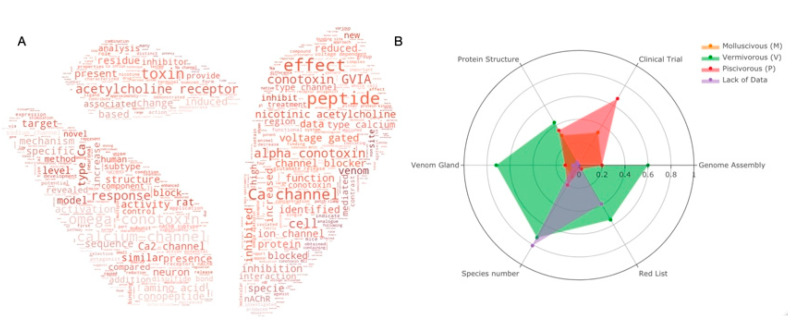
Figure 3.
(A) Keyword cloud from the abstract of Conus studies over the past 20 years; (B) Statistics of current Conus studies. Ratio of six categories (genome assemblies, species under clinical trials, characterized protein structures, venom glands, species number and red list species) for Conus species of each feeding habit are presented in the radar plot. Orange for molluscivous (M), red for piscivorous (P), green for vermivorous (V) and species with insufficient data are presented in purple. Species with more than one feeding habit are counted separately in each group. Raw statistics can be seen in Supplementary Tables S3 and S4.

