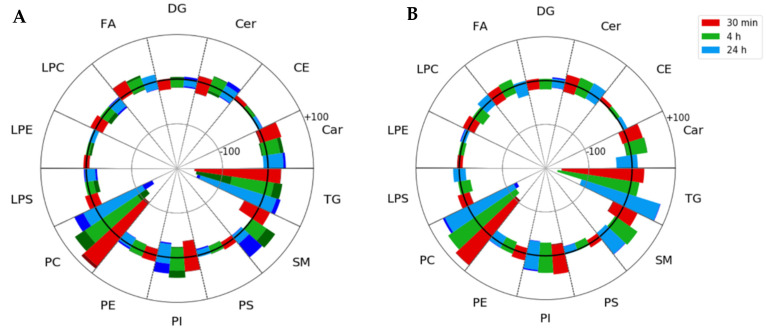
Figure 3.
Spider plots of all identified lipids, grouped by lipid classes, shown over the time course of injury progression. Each main lipid class segment contains all three post-injury timepoints, with red, green, and blue bars corresponding to 30 min, 4 and 24 h post-injury timepoints, respectively. Circles within the spider plot correspond to 100 total identified lipids, with the central bold circle corresponding to the zero line. Each post-injury timepoint bar shows the total number of lipids that exhibited either increased median fold change in TBI samples from baseline and fell above the zero line or decreased in TBI samples and fell below the zero line. Darker colors indicate the total number of features with statistically significant changes from baseline after Benjamini–Hochberg correction, and are shown at the tip of each segment. (A) Analysis of identified lipids in the repeat (3×) impact injury model and (B) analysis of identified lipids in the single (1×) impact injury model. Car—acyl carnitines, CE—cholesteryl esters, Cer—ceramides, DG—diacylglycerols, FA—fatty acids, LPC—lysophosphatidylcholine, LPE—lysophosphatidylethanolamine, LPS—lysophosphatidylserine, PC—phosphatidylcholine, PE—phosphatidylethanolamine, PI—phosphatidylinositol, PS—phosphatidylserine, SM—sphingomyelin, TG—triacylglycerol.

