Figure 2:

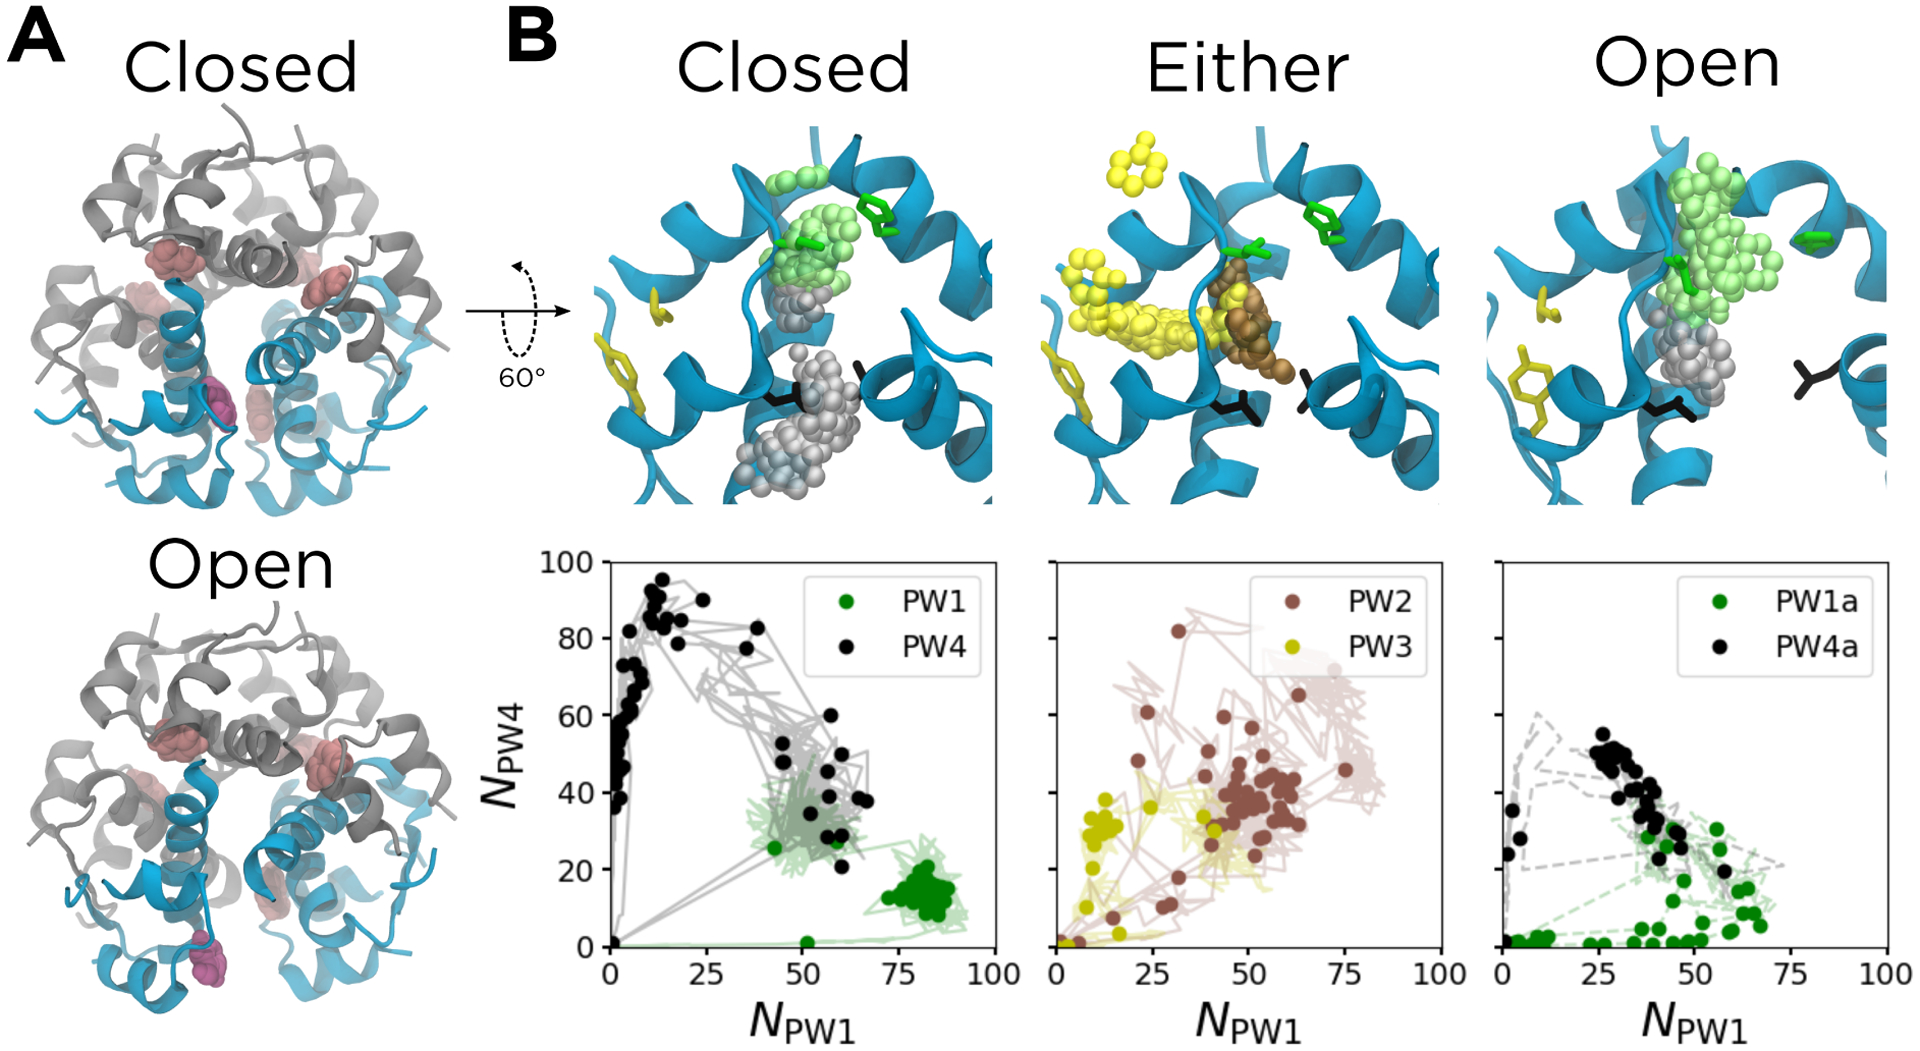
Results from the ABMD simulations. (A) The structure of the hexamer, with the phenolic escape channel closed (top) and open (bottom). The chains that form the phenolic binding pocket are shown in cyan; other chains are shown in gray. The released phenol is shown in purple, with other phenols shown in pink. (B) The six unbinding pathways, shown both structurally (top) and as a function of NPW1 and NPW4 (bottom). The structures shown correspond to the solid data points, and represent the k-medoids cluster centers along each pathway. The solid protein cartoons correspond to the starting structure for each set of driven simulations, and the translucent spheres are the non-hydrogen atoms of the phenols from the cluster centers, all aligned to the A chain backbone of the starting structure. The translucent lines in the bottom panels represent the data used to generate the k-medoids clusters. The cyan chains in the top panels are the same as those in (A). Non-hydrogen atoms of gatekeeper side chains along PW1 (green, IleA10 and HisF5), PW3 (yellow, IleA2 and TyrA19), and PW4 (black, LeuA13 and LeuH17) are also shown in the top panels. The configuration of the escape channel is indicated above each panel. For PW2 and PW3, the channel can be either open or closed.
