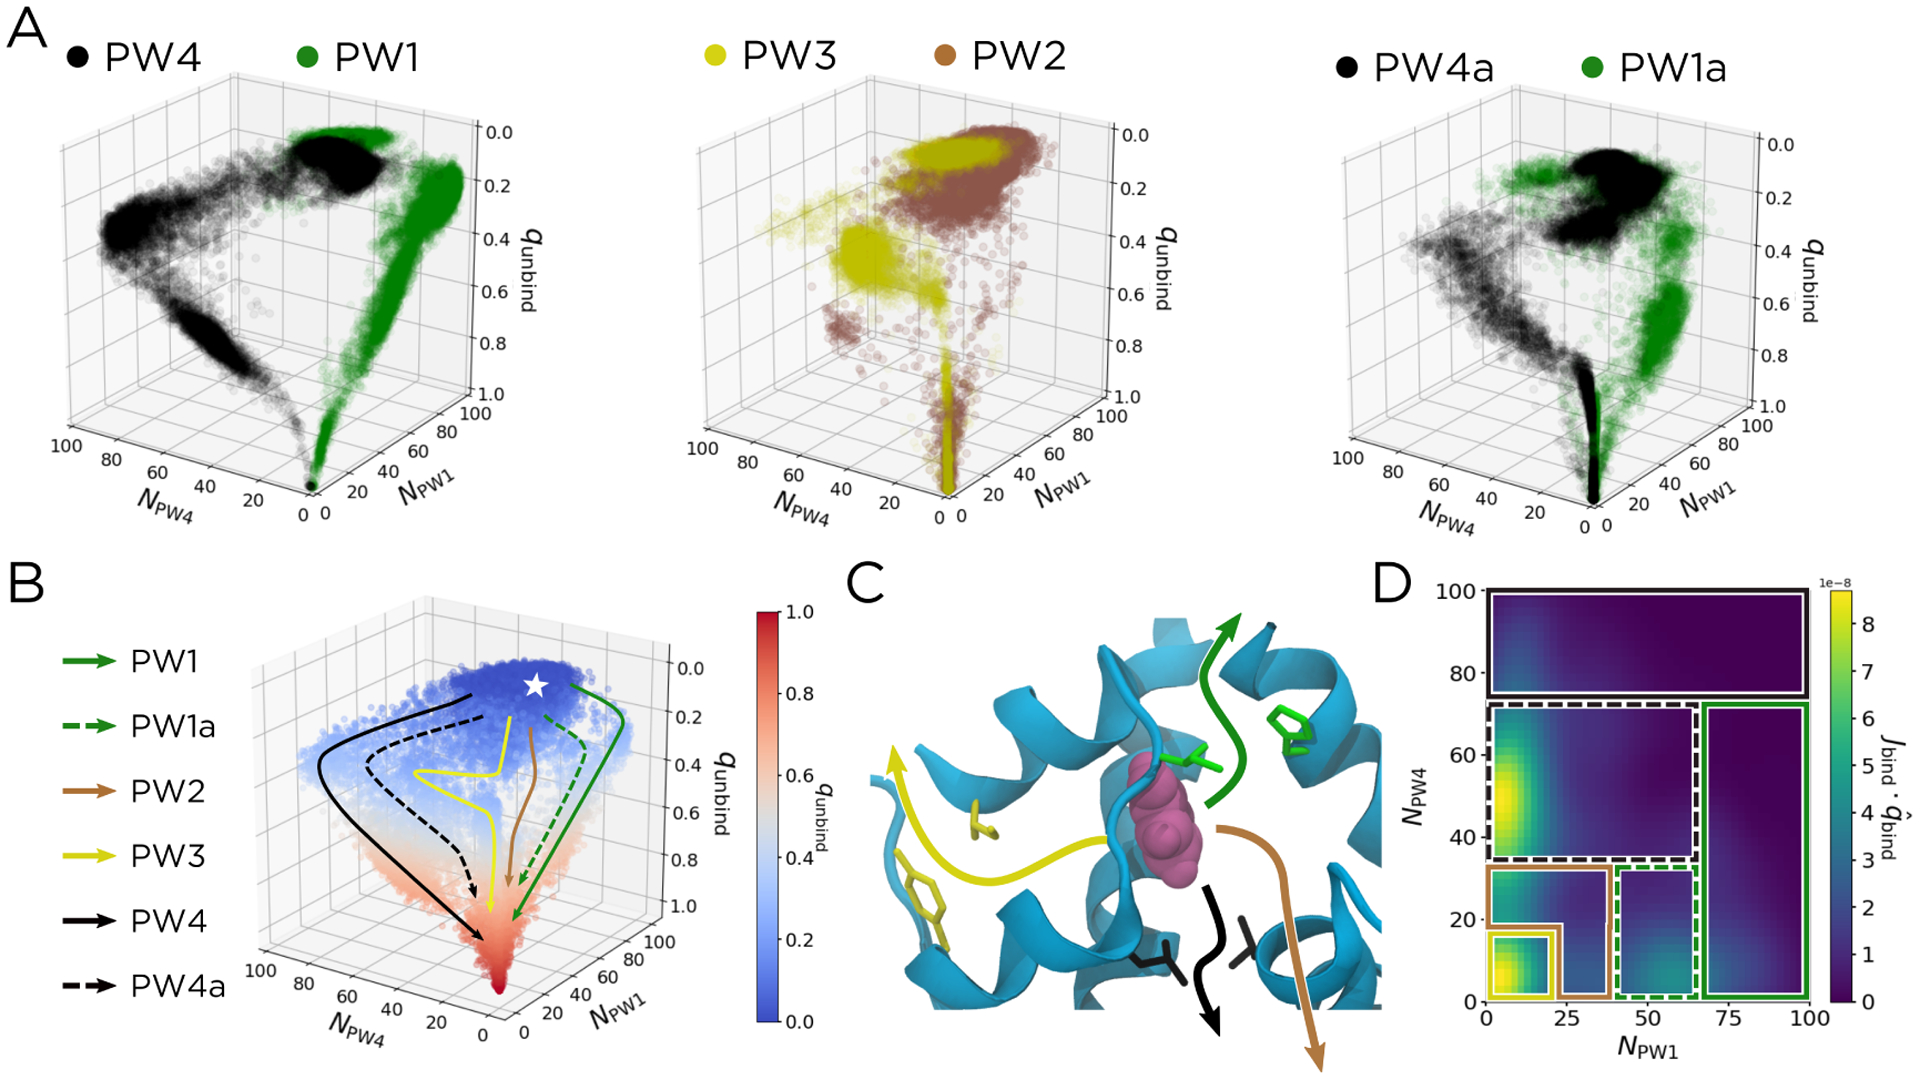
Figure 5:

Pathways can be more readily distinguished in the space of NPW1, NPW4, and qunbind. (A) Scatter plots of trajectories along each of our six pathways. From the unbiased data set, we identify four trajectories that correspond to each pathway, which are shown for PW1/PW4 (left), PW2/PW3 (middle), and PW1a/PW4a (right), mirroring the conventions used in Figure 2B. (B) A scatter plot of qunbind for all the unbiased data. Six pathways are overlaid and labelled. The bound state is represented by the white star. (C) Structural representation of the unbinding pathways in (B). The dashed arrows in (B) correspond to the similarly-colored solid arrows in (C), except with the escape channel being opened as in Figure 3. (E) The qbind component of Jbind, taken at qbind = 0.63. The patches corresponding to each pathway are overlaid, using the coloring and line styles from (B).
