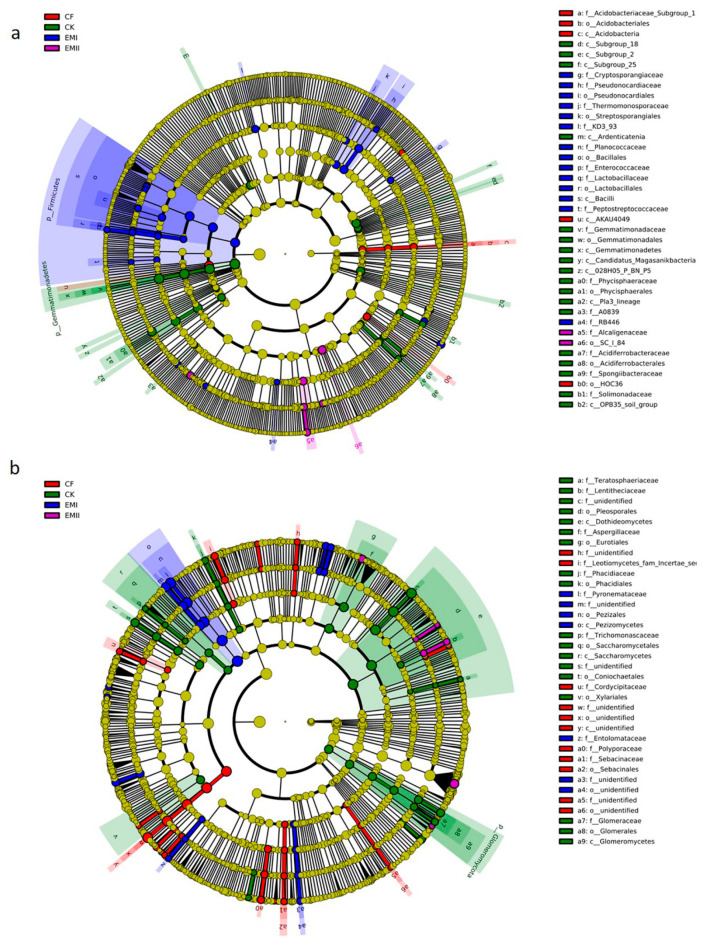
Figure 5.
LEfSe analysis of soil bacterial (a) and fungal (b) biomarkers under different fertilization treatments. Cladogram representing the taxonomic hierarchical structure of the phylotype biomarkers identified among fertilization treatments. Five rings of the cladogram stand for kingdom(innermost), phylum, class, order, family, genus, and species (outermost), respectively. Each small circle represents one biomarker. Each colour means that phylotypes were over represented in corresponding treatment except for yellow. Yellow phylotypes were not significantly different among treatments.

