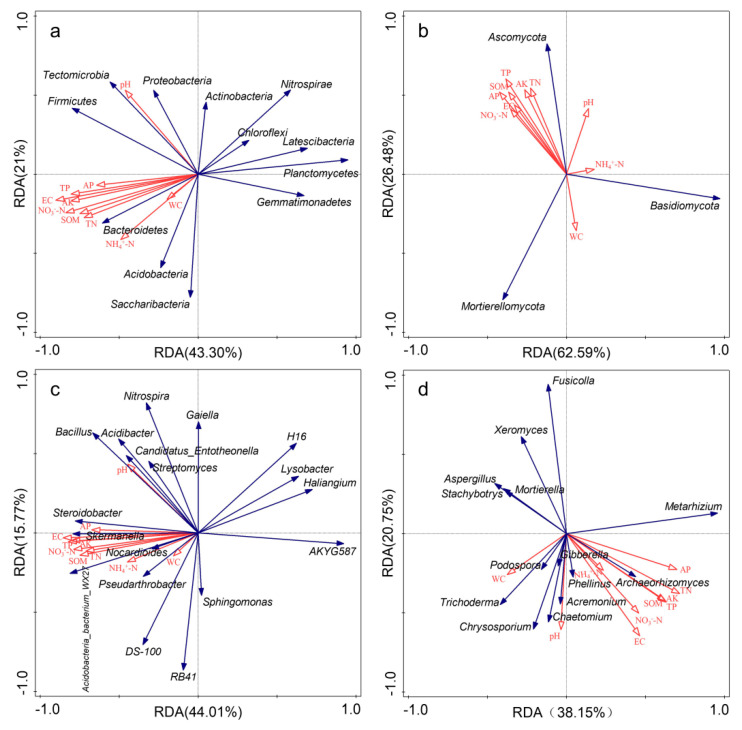
Figure 6.
Redundancy analysis (RDA) between soil properties and microbial community composition (relative abundance > 1%) under different fertilization treatments. Red arrows represent soil properties; blue arrows represent different species. (a): bacterial phyla; (b): fungal phyla; (c): bacterial genera; (d): fungal genera.

