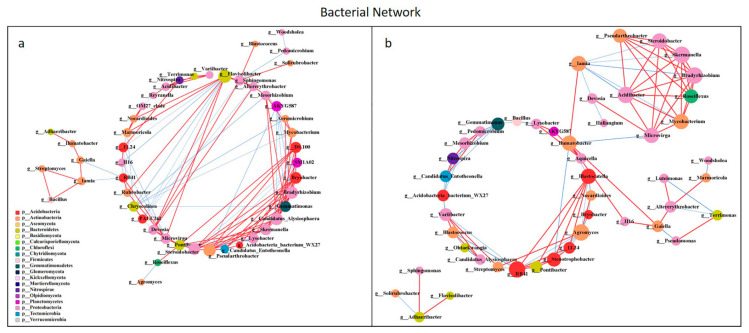
Figure 7.
Network analysis showing the co-occurrence of bacterial communities under non-bio-compost (a) and bio-compost (b) treatments. The co-occurring networks are colored by microbial taxonomic information at the phylum level. The red lines represent significantly positive (r > 0.6) interrelationships, blue lines represent negative (r < −0.6) interrelationships. The size of the node represents the degree, and the width of the lines represents the strength of the correlation. Non-bio-compost treatments include CK and CF, and bio-compost treatments include EMI and EMII.

