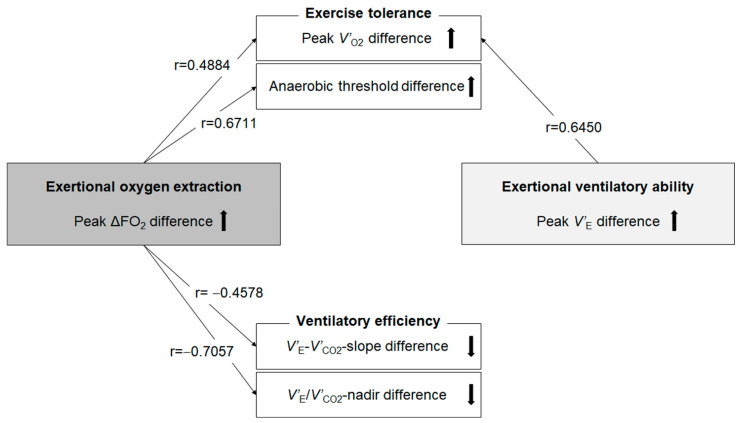
Figure 3.
Correlations related to exercise tolerance and ventilatory efficiency. Difference: between before and after pulmonary rehabilitation; ΔFO2: difference between inspired and expired O2 concentration; V’E: minute ventilation; V’E/V’CO2-nadir: lowest value of the ratio between minute ventilation and carbon dioxide output during exercise (see the Methods section for details); V’E–V’CO2-slope: the slope was determined by linear regression analysis of minute ventilation to carbon dioxide output observed during exercise (see the Methods section for details); V’O2: oxygen uptake. Black arrows mean the up and down differences obtained from pulmonary rehabilitation.

