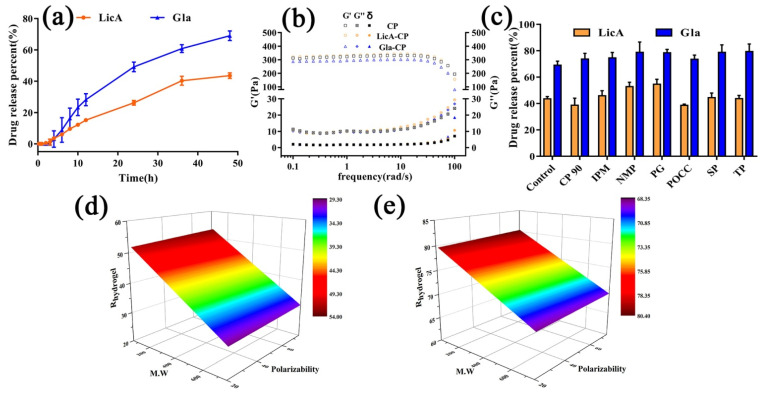
Figure 3.
(a) In vitro drug release profiles of hydrogel (n = 3); (b) frequency sweep (G′, G″, and δ) of the hydrogel (n = 3); (c) LicA and Gla release percent after48 h after different enhancers were added (n = 3); (d) response surface plot demonstrating the effect of MW and polarizability on the ERrelease of LicA; (e) response surface plot demonstrating the effect of MW and polarizability on the ERrelease of Gla.

