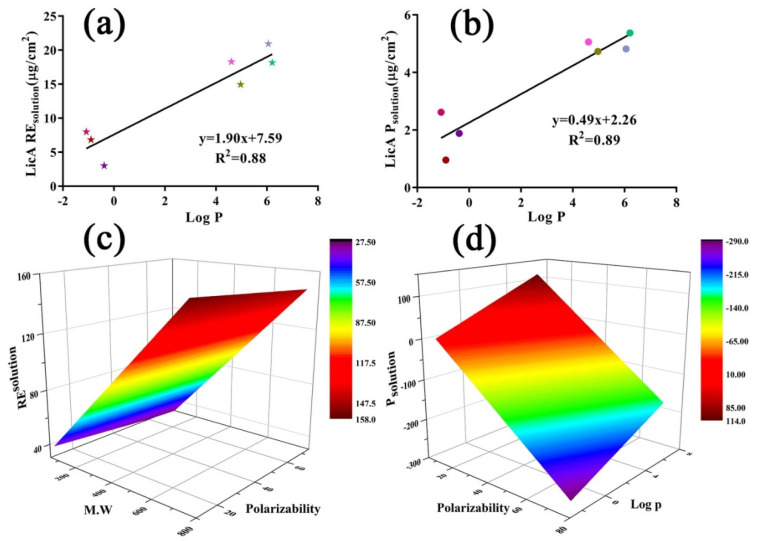
Figure 9.
(a) The correlation relationship between LicAREsolution and log P of enhancers; (b) linear analysis of LicAPsolution and log P of enhancers; (c) response surface plot demonstrating the effect of MW and polarizability on REsolution of Gla; (d) response surface plot demonstrating the effect of log P and polarizability on Psolution of Gla.

