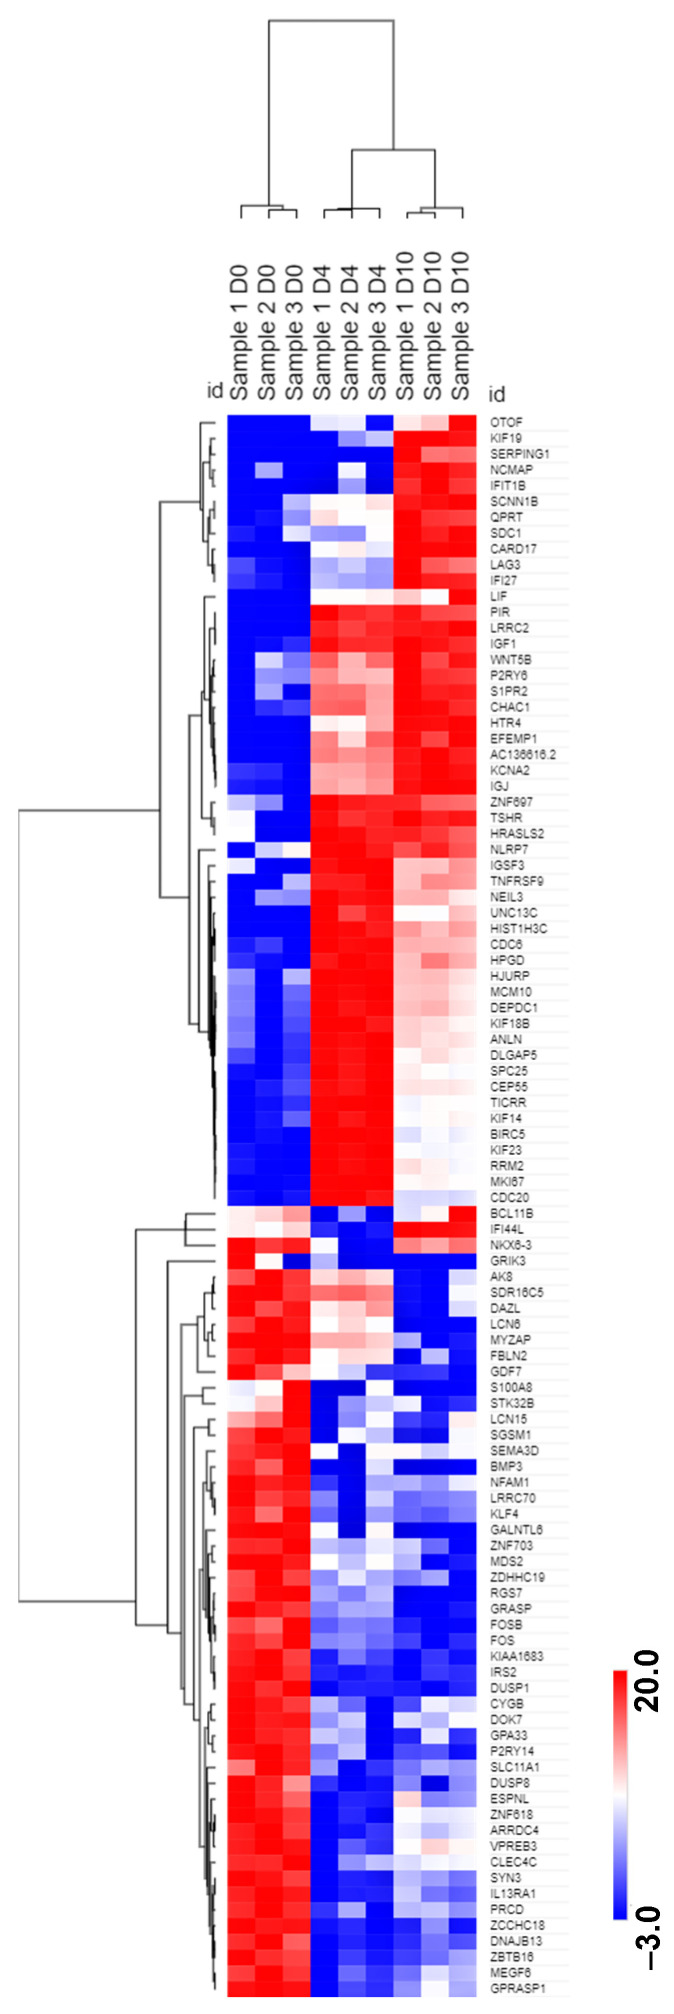
Figure 3.
Hierarchical clustering of differentially expressed transcripts during differentiation from D0 resting B cells to D10 IVPCs. The top 100 differentially expressed non-Ig protein-coding transcripts based on fold change (FC) ≥ 2.0 and false discovery rate (FDR) ≤ 0.05 were analyzed by Morpheus software for hierarchical clustering using log2 transformed pseudo-counts and Pearson correlation. The color scale bar represents relative expression based on log2 transformed pseudo-counts.

