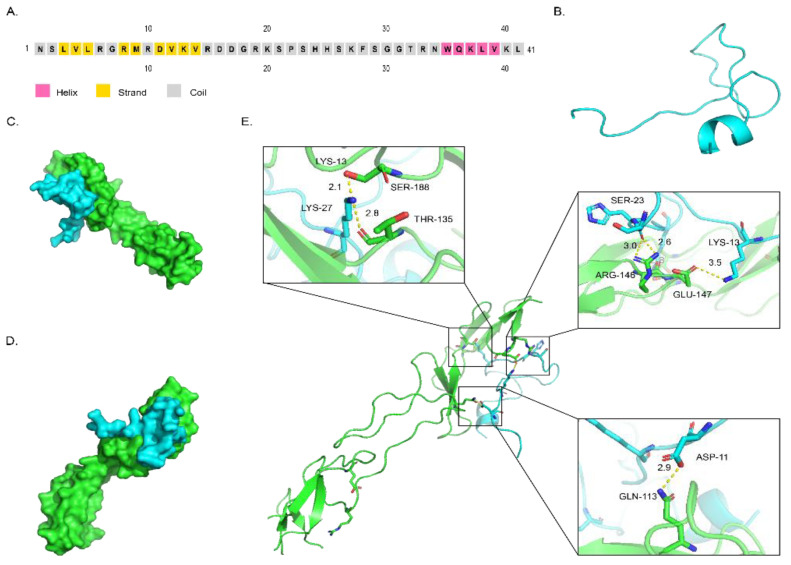
Figure 2.
The spatial structures of DAvp-1 and its binding configurations with TNFR1. (A). The secondary structure of DAvp-1. (B). Three-dimensional diagram of DAvp-1 structure is shown in cartoon representation in cyan. (C,D). The different visual angles of the binding between DAvp-1 and TNFR1 shown as surface diagram, with DAvp-1 in cyan and TNFR1 in green. (E). The diagram of the hydrogen bonds between DAvp-1 and TNFR1, with the diagram of DAvp-1 and TNFR1 shown in cartoon representation, except for binding residues shown in stick representation, with DAvp-1 in cyan and TNFR1 in green. The hydrogen bonds are shown as dashed yellow lines, and the helical elements and residues participating in hydrogen bonds are labeled.

