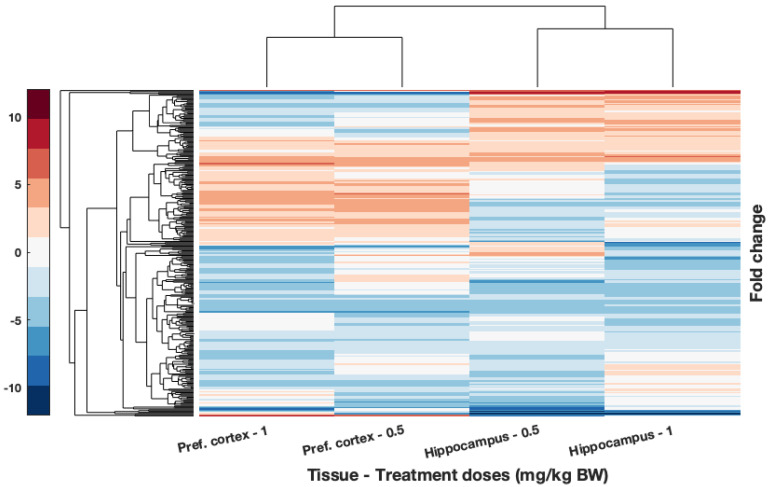
Figure 6.
Hierarchical clustering of DEGs from brain tissues with significant accumulation of cobalt: the pref. cortex and hippocampus from rats treated with 0.5 and 1 mg/kg B.W. CoCl2. DEGs were obtained from RNA-Seq comparing the RNA isolated from those tissues with those of controls treated with dH2O. Condition applied is for fold change to be over 2. Upregulated genes are shown in red while downregulated are displayed in blue. Hierarchical clustering and resulting dendrogram were generated with Euclidian distance. Samples analysed through RNA-Seq were pooled (n’ = 1) from n = 4 pref. cortex samples, n = 3 in hippocampus from 0.5 mg/kg B.W. CoCl2 treatment group, and n = 1 from 1 mg/kg B.W. CoCl2 treatment group.

