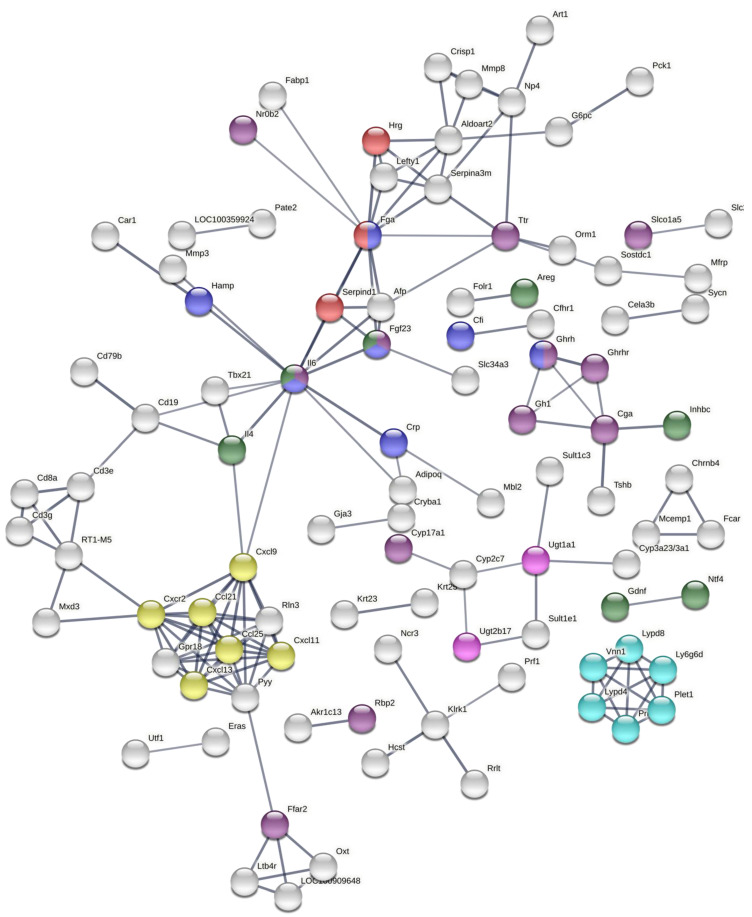
Figure 7.
Protein–protein interaction (PPI) network obtained from the STRING web tool by analysing DEGs as their protein products. DEGs were obtained from RNA-Seq analyses of the pref. cortex and hippocampus from rats treated with 0.5 and 1 mg/kg B.W. CoCl2 against controls treated with dH2O for 28 days of i.p. injections. The following terms/keywords have been highlighted: cellular response to interleukin-6 (blue), regulation of hormone levels (purple), chemokine receptors bind chemokines (yellow), blood coagulation (red), UDP-glucuronosyltransferase activity (pink), growth factor activity (green), and post-translational modification: synthesis of GPI-anchored protein (cyan). The thickness of links between nodes represent the confidence in the interaction, only nodes connected with high confidence (0.7) are displayed.

