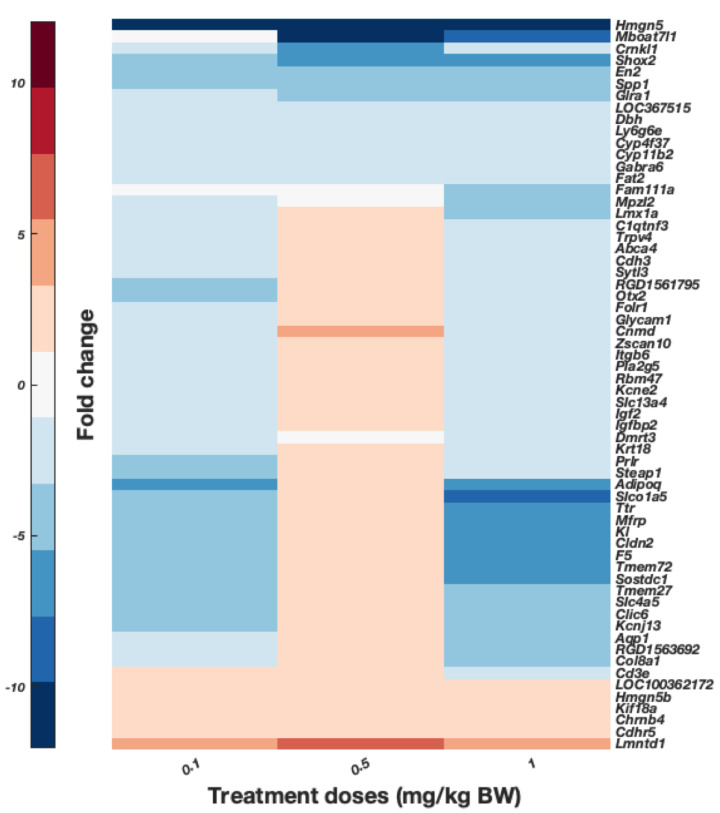
Figure 9.
DEGs expressed in hippocampus of rats treated via i.p. with daily injections of 0.1, 0.5, and 1 mg/kg B.W. CoCl2 or dH2O (control groups) for 28 days. Pooled samples (n’ = 1 from n = 4 samples in group 0.1 mg/kg B.W. CoCl2, n = 3 from 0.5 mg/kg B.W. CoCl2, and n = 1 from 1 mg/kg B.W. CoCl2 group) were analysed through RNA-Seq and data are presented as the result of hierarchical clustering. DEGs in the graph are only those with fold-change >2 and p < 0.05 from RNA-Seq Poisson distribution, dendrogram is not shown. Colour bar presents fold-change: upregulated genes in red and downregulated genes in blue.

