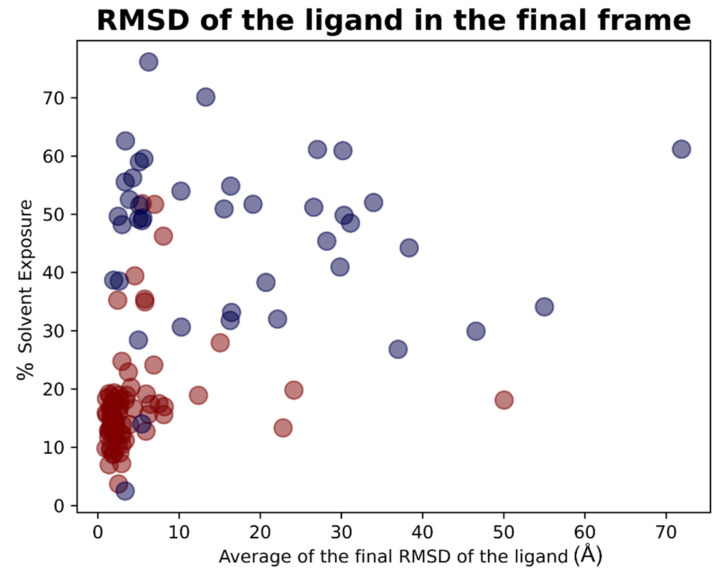
Figure 14.
Scatter plots showing the different distribution of the mean RMSD values between the final coordinates of the Mpro ligands compared to crystallographic ones after the molecular dynamics simulations in respect to the solvent exposure of the corresponding crystallographic ligands. The red dots represent the ligands thatwere originally crystallized inside the catalytic pocket, while the blue dots represent the ligands crystallized in the other parts of Mpro. As can be noticed, the molecules showing the best values of RMSF after the analysis of the trajectories are mainly located inside the catalytic pocket and characterized by a low solvent exposure of the original crystallographic pose.

