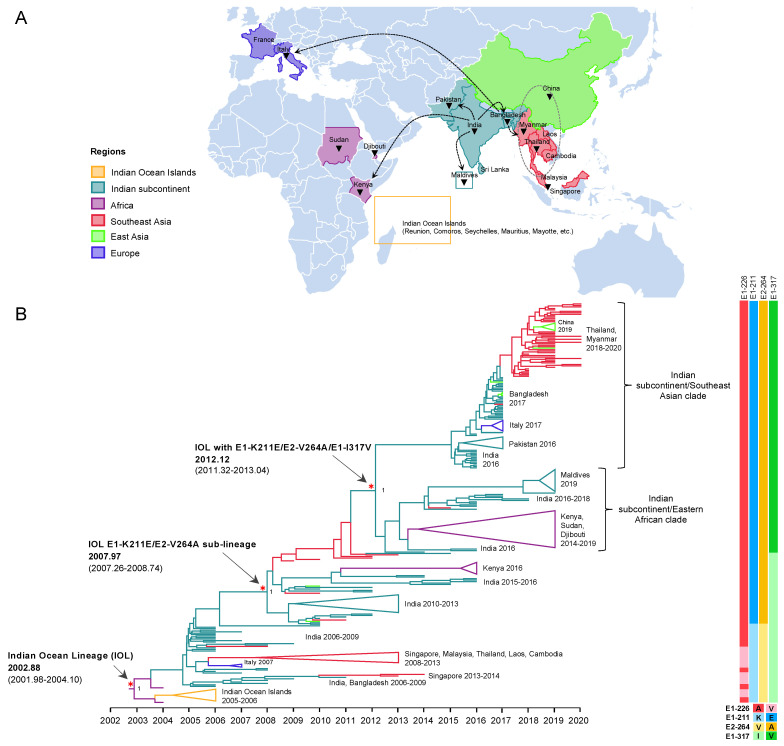
Figure 1.
Evolution and geographic distribution of IOL. (A) A map showing the location of IOL CHIKV whole-genome sequences analyzed in the present study. The black triangles indicate countries in which IOL sub-lineage E1-K211E/E2-V264A was circulating. Dotted arrows indicate probable transmission routes. (B) The maximum clade credibility tree (MCC) for 271 Indian Ocean Lineage (IOL) of CHIKV open reading frame sequences constructed by BEAST under uncorrelated lognormal clock and GTR + F + I + G4. The emergence of the IOL and IOL sub-lineage E1-K211E/E2-V264A with the time of the most recent common ancestor (tMRCA) and its 95% highest probability density (95% HPD) are indicated by red asterisks and arrows. The numbers of posterior probability (PP) support are shown adjacent to the key nodes. The Indian subcontinent/Eastern African clade and Indian subcontinent/Southeast Asian clade are indicated in the right bracket. Triangular clades represent collapsed sequences indicated to the right. The branch color corresponds to the geographic region indicated. The timescale in years is shown on the x-axis at the bottom. The amino acid mutations specific to each lineage are shown on the right, and the color corresponds to the amino acid indicated below.

