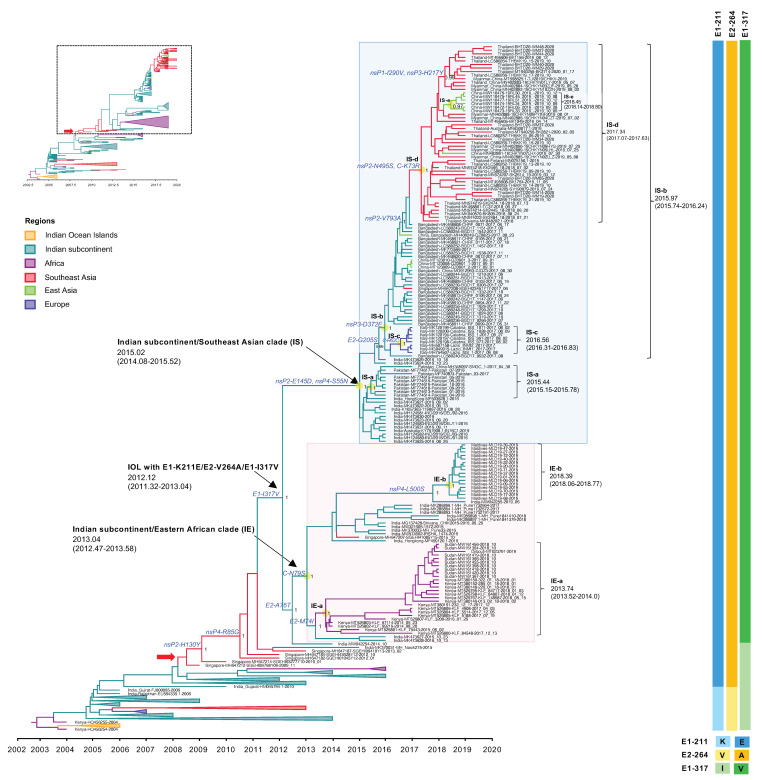
Figure 3.
An enlarged view of the IOL MCC tree showing IOL sub-lineage E1-K211E/E2-V264A and E1-I317V of the IOL MCC tree corresponding to the dotted square region of the top-left inset of reduced Figure 1B. The Indian subcontinent/Eastern African (IE) clade and Indian subcontinent/Southeast Asian (IS) clade with the most recent common ancestor (tMRCA) and 95% highest probability density (95% HPD) are indicated by arrows and the pink- and light blue-shaded boxes, respectively. The number of posterior probability (PP) support and amino acid substitutions are shown adjacent to the ancestral key nodes. IOL clades, tMRCA, and 95% HPD are shown in brackets. The branch color corresponds to the geographic region indicated. The timescale in years is shown on the x-axis at the bottom. The amino acid mutations specific to each lineage are shown on the right, and the color corresponds to the amino acid indicated below.

