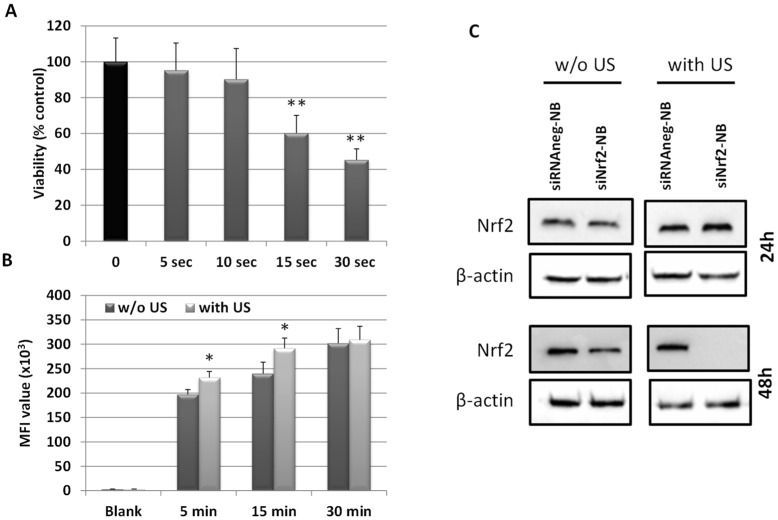
Figure 6.
(A) Viability was determined by the MTT assay at 24 h in M14 cells exposed to US at the indicated times. Results are expressed as the percent of the relative control values and are the mean ± SD. ** p ≤ 0.01 vs. 0 s. (B) Fluorescent images of 6-coumarin-NB uptake in exposed (with US) or nonexposed (w/o US) M14 cells to US at the indicated time. Green fluorescence of 6-coumarin was examined by a cytofluorimetric analysis. Results are expressed as the median fluorescence intensity (MFI) values (means ± SD). * p ≤ 0.05 ** p ≤ 0.01 US exposed vs. unexposed US cells. (C) Western blot analysis of Nrf2 in M14 cells treated with siNrf2-NB or siRNAneg-NB in exposed (with US) or nonexposed (w/o US) to US at 24 h and 48 h.

