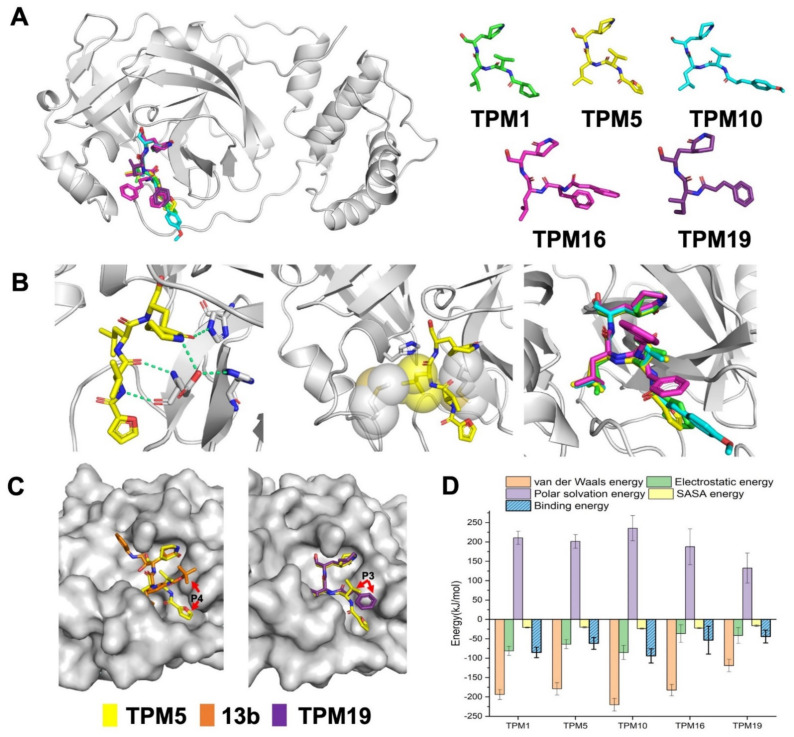
Figure 3.
Crystal structures of the 3CLPro–TPM complexes. (A) 3D representation of five TPMs and their overall binding modes. (B) The P1 δ-lactam ring formed polar interactions (green, dash line) with S1 residues (left), P2 isopropyl group stacked with S2 hydrophobic residues (middle), and the alignment of isopropyl groups from different TPMs (right). (C) The P3/P4 group of TPM5 bound into the S3/S4 groove in comparison to that of 13b or TPM19. (D) The binding energies between 3CLPro and TPMs from all-atom simulations.

