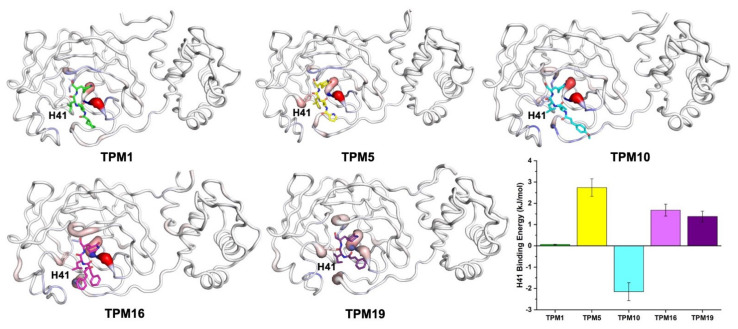
Figure 4.
The interactions between TPMs and surrounding residues. The distribution of ΔGbind on the 3CLPro residues are illustrated with grey (ΔGbind ≈ 0), red (ΔGbind > 0), and blue (ΔGbind < 0) colors. The interaction energies between the H41 residue (shown as sticks) and TPMs are summarized as a histogram (average values of three independent trajectories, each of 1000 snapshots).

