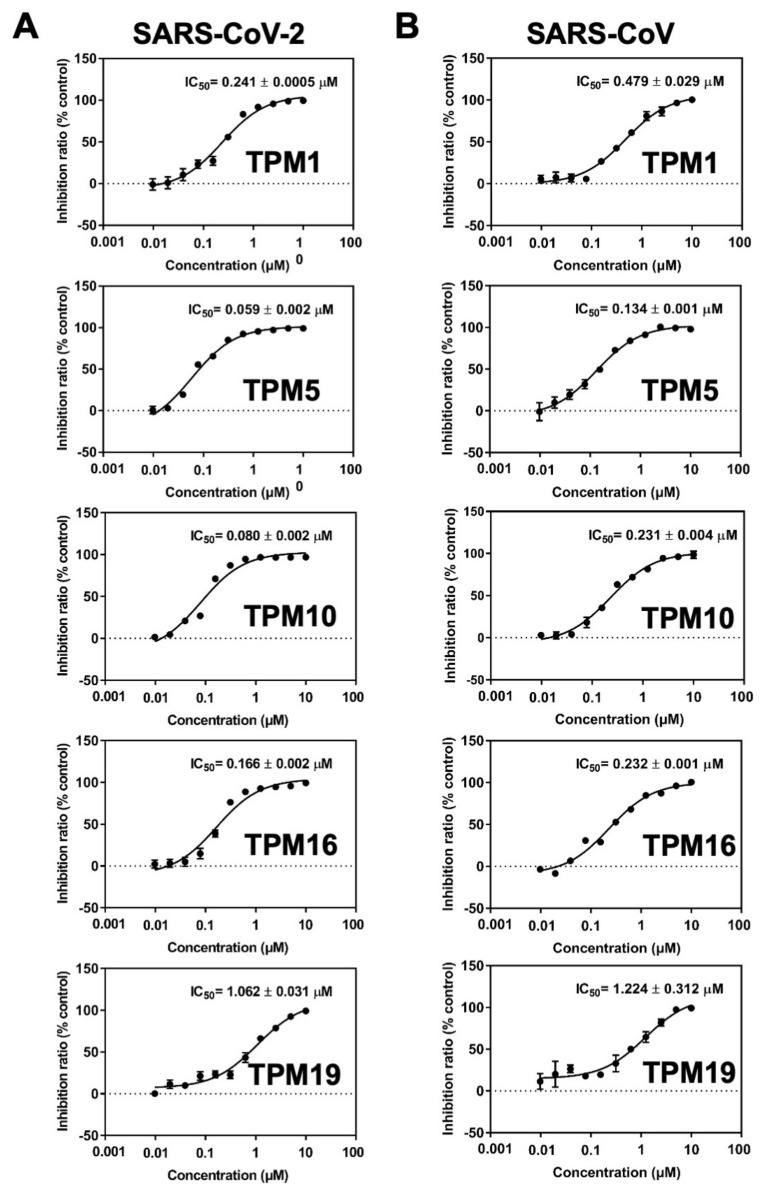
Figure 6.
Dose–response curves of TPMs in the 3CLPro enzymatic activity assays. IC50 of inhibitors on SARS-CoV-2 (A) and SARS-CoV (B) 3CLPro. From top to bottom: TPM1, TPM5, TPM10, TPM16, and TPM19. The TPM’s mediated inhibition was measured for both SARS-CoV-2 and SARS-CoV 3CLPro. Bars depict the mean ± SE, n = 3.

