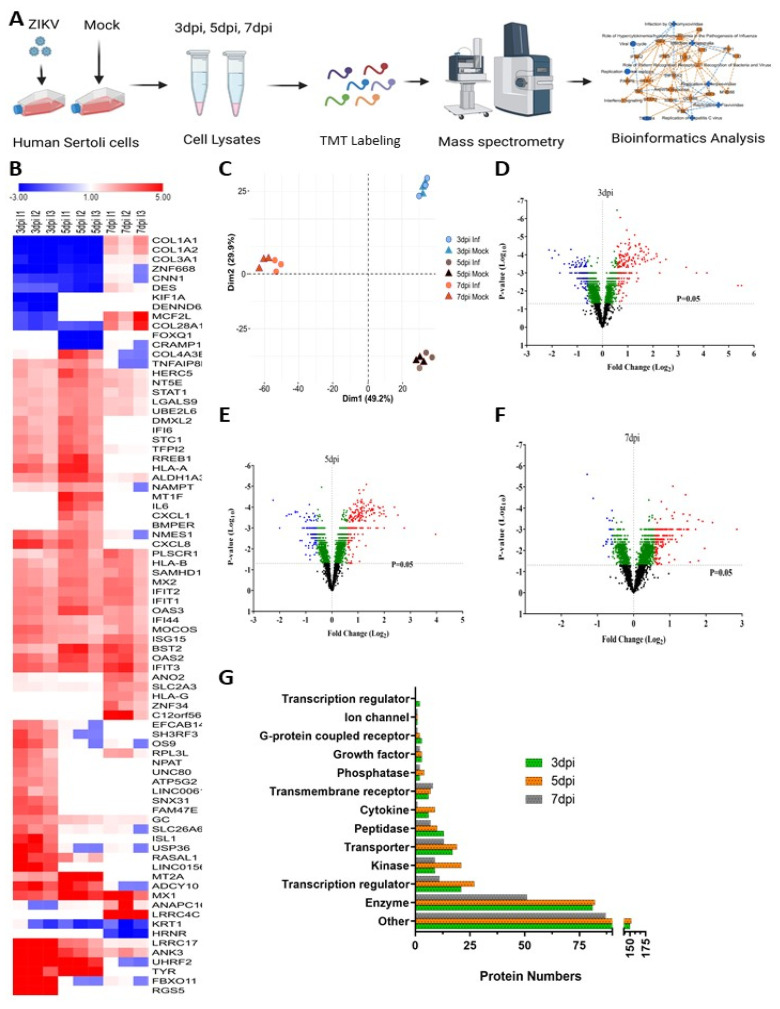
Figure 2.
Detection of cellular protein level alterations in ZIKV-infected Sertoli cells by mass spectrometry. (A) Schematic flow diagram of the study design. (B) Heatmap of most affected proteins (Fold change ≥ 2.5 or ≤−2.5; p value < 0.05) by ZIKV infection in Sertoli cells. Red and blue colors indicate up-regulation and down-regulation, respectively. (C) PCA plot of proteomic data from mock- and ZIKV-infected cells, from all three replicates. Volcano plots displaying the protein level alterations after ZIKV infection at 3 dpi (D), 5 dpi (E), and 7 dpi (F). Red = significantly up-regulated (FC > 1.5; p-value < 0.05), blue = significantly down-regulated (FC < −1.5; p-value < 0.05), green = significantly affected (p-value < 0.05, but FC < ±1.5), black = not significantly affected (p-value > 0.05). (G) Classification of significantly altered (Fold change ≥ 1.5 or ≤ −1.5; p value < 0.05) protein types at different time points after ZIKV infection. Abbreviations. FC = Fold change; dpi = Days post infection; inf = Infected.

