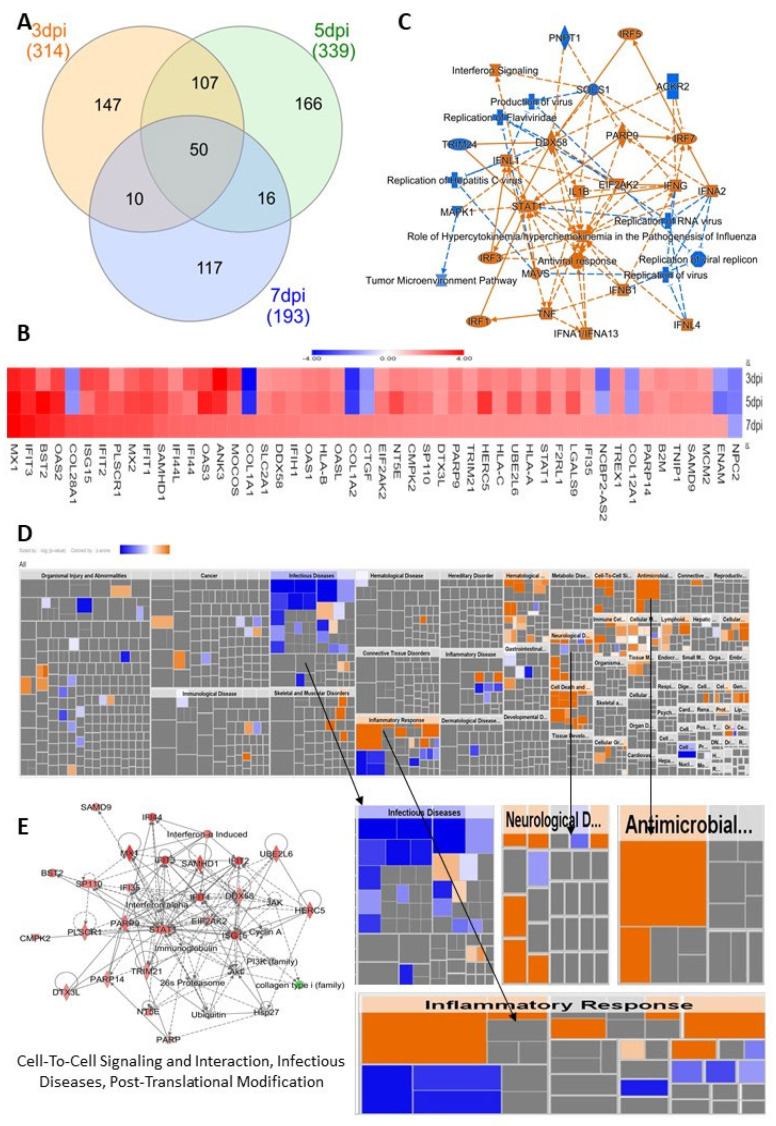
Figure 4.
Impact of commonly affected proteins in HSerC by ZIKV on cellular functions and diseases. (A) Venn diagram of altered proteins at 3, 5 and 7 dpi. (B) Summary of IPA analysis showing the most affected bio-functions, canonical pathways and affected protein networks and their relationship by the commonly affected proteins. (C) Heatmap of the 50 commonly affected proteins at 3, 5 and 7 dpi. Red/orange and blue represent up-regulation and down-regulation, respectively. (D) Heat map of the disease and biofunctions affected by the commonly affected proteins. (E) The protein–protein interaction networks affected by the commonly altered proteins. Red and green represent up-regulation and down-regulation, respectively; gray proteins denote that they were recognized in the present study, but not significantly regulated; colorless proteins interact with molecules in the network, but were not identified in our study. Abbreviations. dpi = Days post infection.

