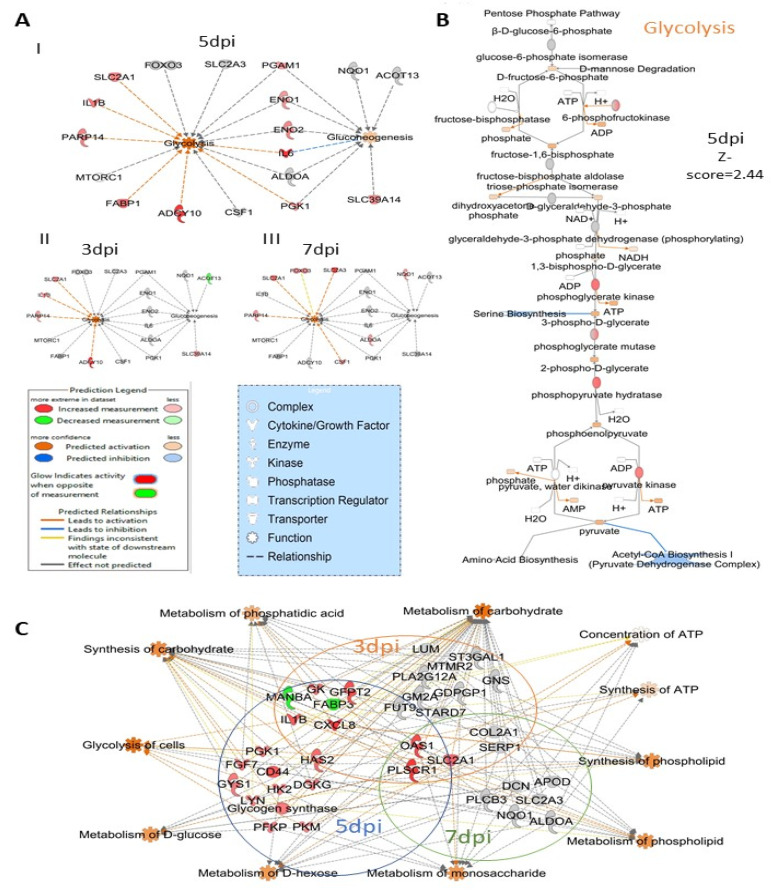
Figure 7.
ZIKV infection impacts carbohydrate metabolism in HSerC. (A) Proteins and enzymes involved in glycolysis and gluconeogenesis pathways affected by ZIKV infection at I. 5 dpi, II. 3 dpi and III. 7 dpi. IPA predicted the impact of ZIKV infection on (B) glycolysis pathway at 5 dpi in Sertoli cells. (C) Proteins involved in carbohydrate metabolism and energy production in cells affected by ZIKV infection. Red and green represent up-regulation and down-regulation of protein levels, respectively. Abbreviations. Dpi = Days post infection.

