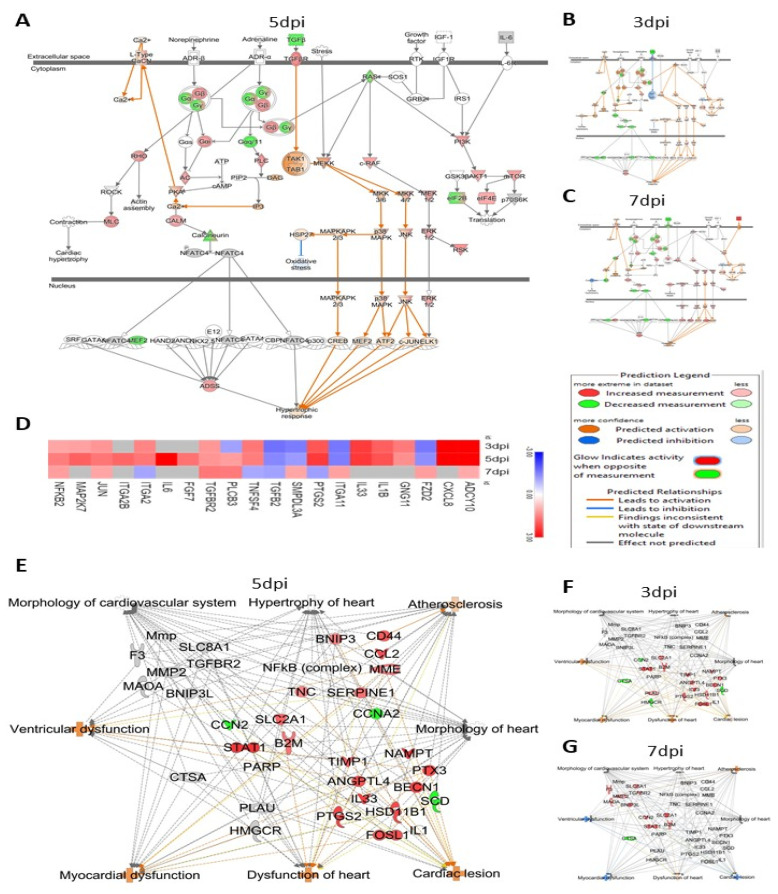
Figure 8.
ZIKV infection significantly affects the levels of proteins involved in the cardiac hypertrophy pathway. IPA predicted activation of the cardiac hypertrophy pathway by Zika virus infection by (A) 3 dpi, (B) 7 dpi and (C) 5 dpi. (D). Heatmap of the proteins involved in cardiac hypertrophy pathway altered by ZIKV infection in HSerC. In the heatmap, red and blue represent up-regulation and down-regulation, respectively. Gray indicates the proteins were not detected at the respective time point. HSerC proteins associated with pathways that increase cardiovascular disease, that are affected by ZIKV infection at (E) 5 dpi (F) 3 dpi and (G) 7 dpi. Red and green represent up-regulation and down-regulation of protein expression, respectively. Abbreviations. dpi = Days post infection.

