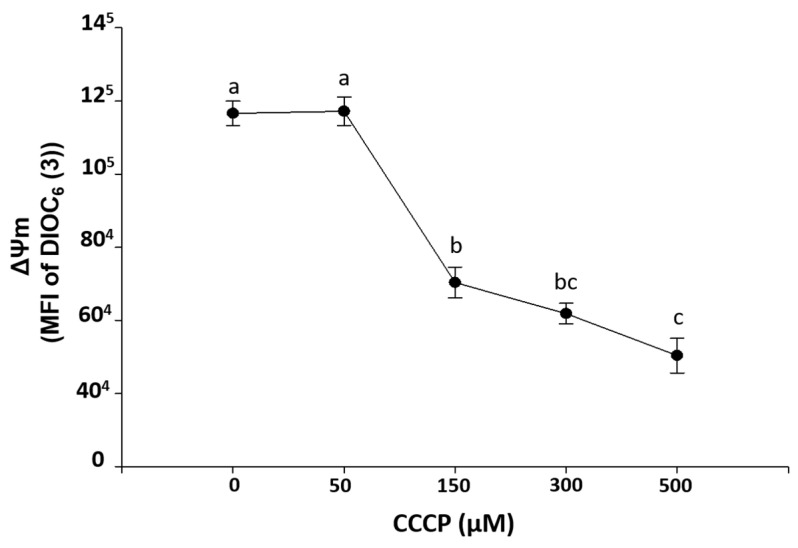
Figure 2.
Induction of ΔΨm loss mitochondrial membrane potential (MFI of DIOC6(3)) by carbonyl cyanide 3-chlorophenylhydrazone exposure (CCCP, 0, 50, 150, 300, and 500 µM) during 15 min on HPBMC from healthy subjects (H). Graphs represent the mean ± SEM of the data from three SARS-CoV-2 negative subjects by duplicate. Different letters indicate statistically significant differences of p < 0.01. For normal data distribution, an analysis of variance (ANOVA) was applied followed by a Bonferroni subtest.

