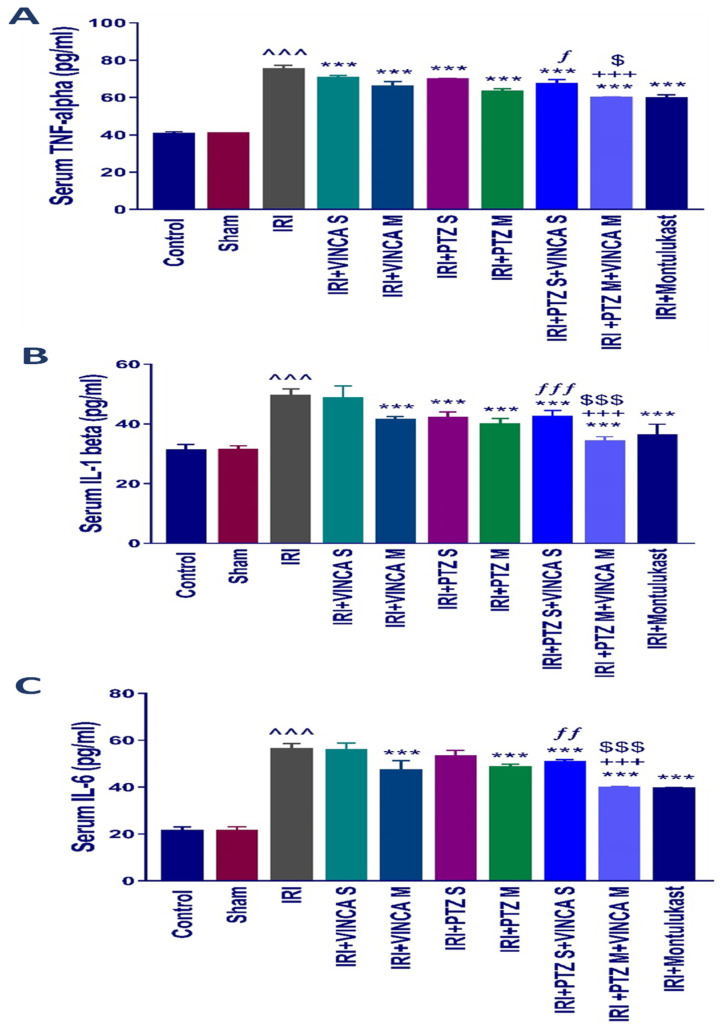
Figure 2.
Impact on the inflammatory cytokine levels. Serum levels of (A) TNF-α, (B) IL-1β, and (C) IL-6 (pg/mL) for the studied groups. Bars represent mean ± SD. After the one-way ANOVA test, the Bonferroni post hoc test was used to determine the significant differences between the groups, where ^^^: p < 0.001, compared to the control rats. ***: p < 0.001, compared to the IRI rodents. $: p < 0.05 and $$$: p < 0.001, compared to the IRI + PTZ M group. ƒ: p < 0.05, ƒƒ: p < 0.01, and ƒƒƒ: p < 0.001, compared to the IRI + VINCA S group. +++: p < 0.001, compared to the IRI + VINCA M group.

