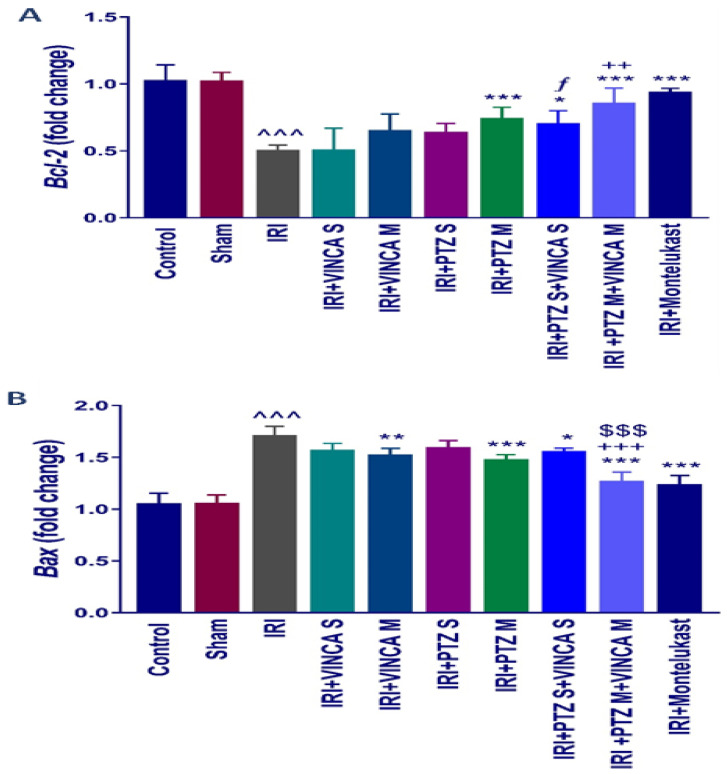
Figure 3.
Bcl-2 (A) and Bax (B) molecular expressions in the kidneys of the studied groups using quantitative real-time polymerase chain reaction (qRT-PCR). Data were presented as fold changes relative to the control group. Bars represent mean ± SD. After the one-way ANOVA test, the Bonferroni post hoc test was used to determine the significant differences between the groups, where ^^^: p < 0.001, compared to the control animals. *: p < 0.05, **: p < 0.01, and ***: p < 0.001, compared to the IRI group. $$$: p < 0.001, compared to the IRI + PTZ M group. ƒ: p < 0.05 compared to the IRI + VINCA S group. ++: p < 0.01 and +++: p < 0.001, compared to the IRI + VINCA M group.

