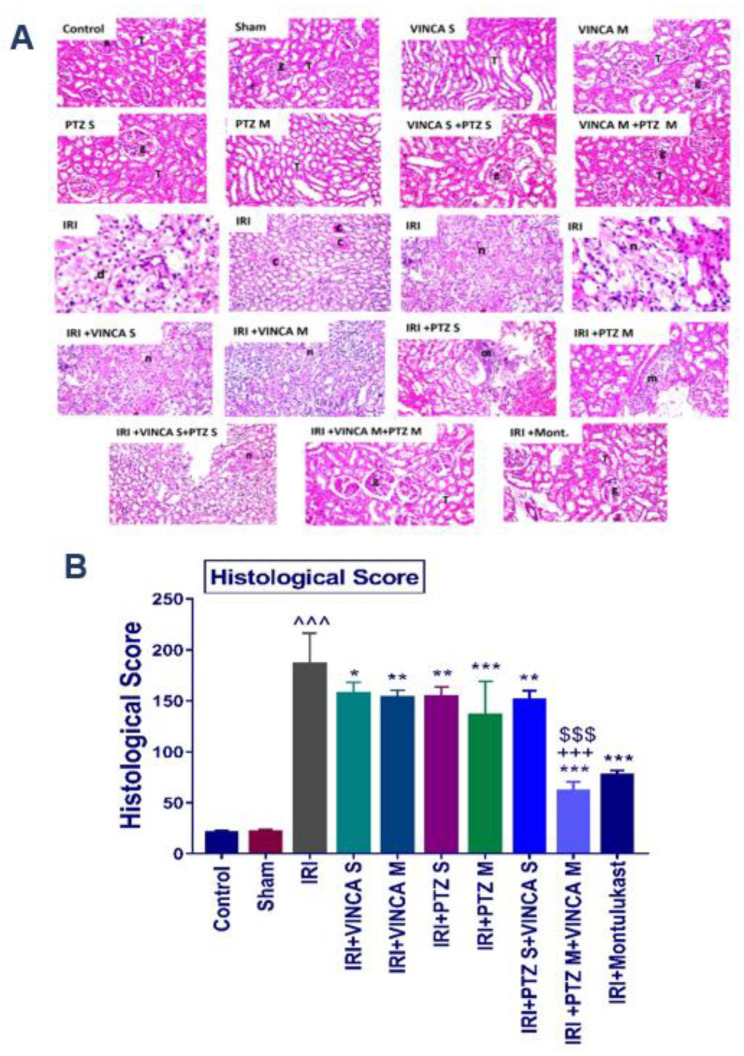
Figure 5.
Histopathological analysis of the kidneys of the studied groups. (A) The hematoxylin and eosin (H & E) slides of the studied groups: the control, Sham, VINCA S, VINCA M, PTZ S, PTZ M, VINCA S + PTZ S, VINCA M + PTZ M, IRI, (IRI + VINCA S), (IRI + VINCA M), (IRI + PTZ S), (IRI + PTZ M), (IRI + VINCA S + PTZ S), (IRI + VINCA M + PTZ M), and (IRI + Montelukast) groups. With (g) representing the cortical glomeruli, (T) tubules, (m) periglomerular focal inflammatory cell aggregates, (d) degraded tubules, (c) eosinophilic casts, and (n) focal coagulative necrosis. Magnification factor: 40. (B) Histological scores of the damage. Bars represent mean ± SD. After the one-way ANOVA test, the Bonferroni post hoc test was used to determine the statistical significance between the studied groups, where ^^^: p < 0.001, compared to the control animals. *: p < 0.05, **: p < 0.01, and ***: p < 0.001, compared to the injured animals. $$$: p < 0.001, compared to the IRI + PTZ M group. +++: p < 0.001, compared to the IRI + VINCA M group.

