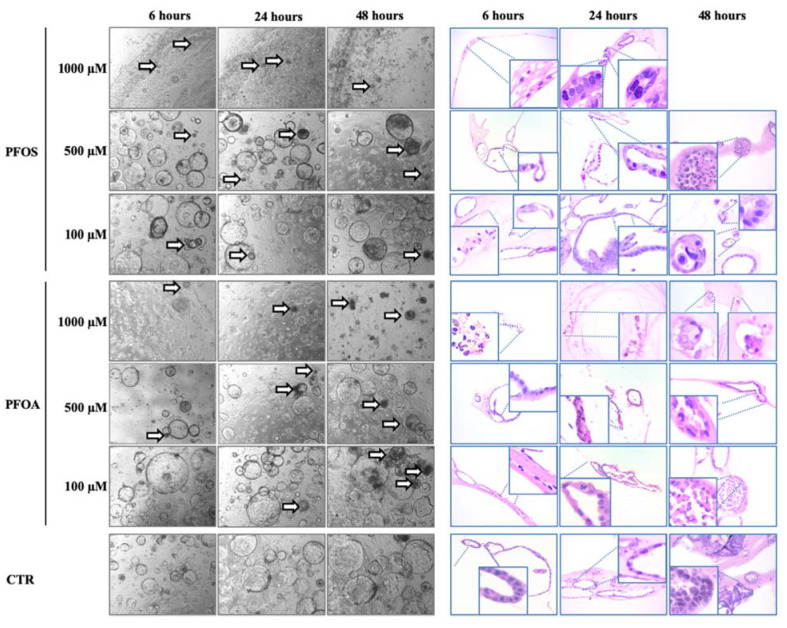
Figure 1.
Morphological changes of mouse liver organoids treated with different concentrations of PFAS. Mouse liver organoids treated with PFOS and PFOA for 6, 24 and 48 h at 1 mM, 500 µM and 100 µM. Images show morphological changes of organoids in bright field and H/E staining. Arrows indicate dead or suffering organoids. Empty panels are due to the toxicity of the treatment that induced organoids death. Zoom areas highlight organoids cellular and nuclear damages. H/E magnification 20×; bright field magnification 4×.

