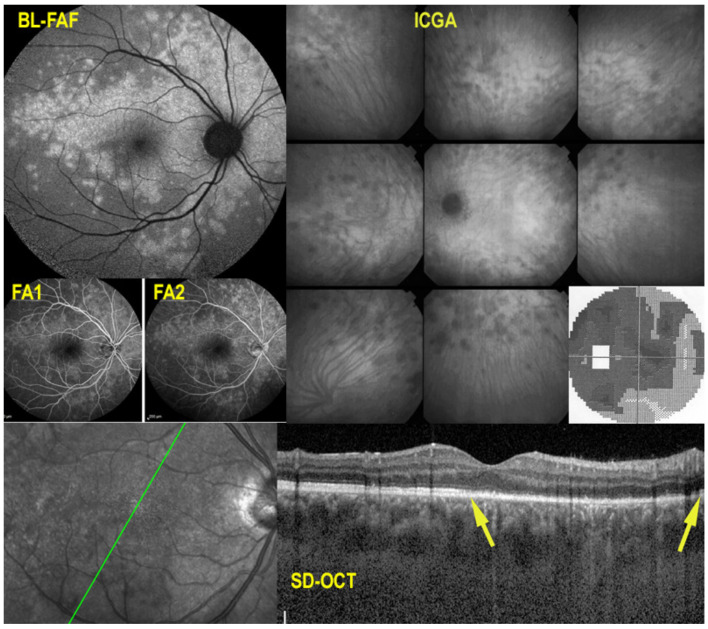
Figure 1.
Multimodal imaging signs in MEWDS. BL-FAF (top left) showing geographic and confluent areas of hyperautofluorescence indicating active lesions. ICGA (top right, different patient) showing patchy areas of hypofluorescence with peripapillary hypofluorescence causing severe visual field loss (insert). FA (middle left) faint hyperfluorescence on early (FA1) and late (FA2) frames. SD-OCT (bottom) showing loss of photoreceptor outer segments (between yellow arrows).

