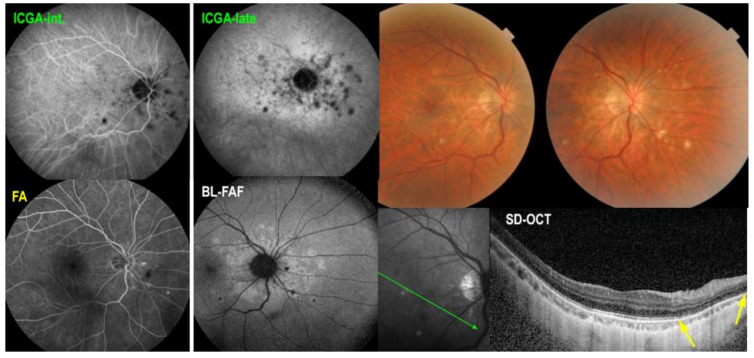
Figure 3.
Multimodal imaging signs in MFC. The ICGA (top two left frames) show numerous hypofluorescent dots in the intermediate angiographic phase, (top left) much better visualized in the late phase frame (ICGA-late). Some hypofluorescent lesions correspond also to the cicatricial lesions visible as hyperfluorescent punctiform spots on fluorescein angiography (bottom left). The BL-FAF picture (bottom middle) shows hyperautofluorescent areas corresponding to active lesions characterized by loss of photoreceptor outer segments shown on SD-OCT (bottom right, between two yellow arrows).

