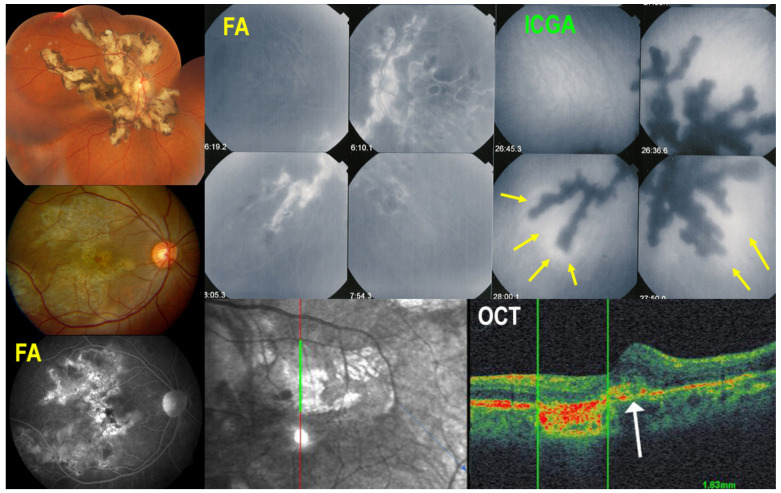
Figure 4.
Multimodal imaging signs in SC. Typical fundus aspect of SC (top left); extensive central atrophy in a different case (middle left) with FA hyperfluorescent window effect (bottom left). Comparison of FA (top middle) and ICGA (top right) findings; ICGA hypofluorescence is much more widespread than FA hyperfluorescence, as it represents both atrophy and choriocapillaris non-perfusion of new lesions. Perilesional ICGA hyperfluorescent halo (yellow arrows) indicates progression of disease. OCT (bottom right) shows that at the border of atrophy, there is retinal oedema and damage to the outer retina (white arrow).

