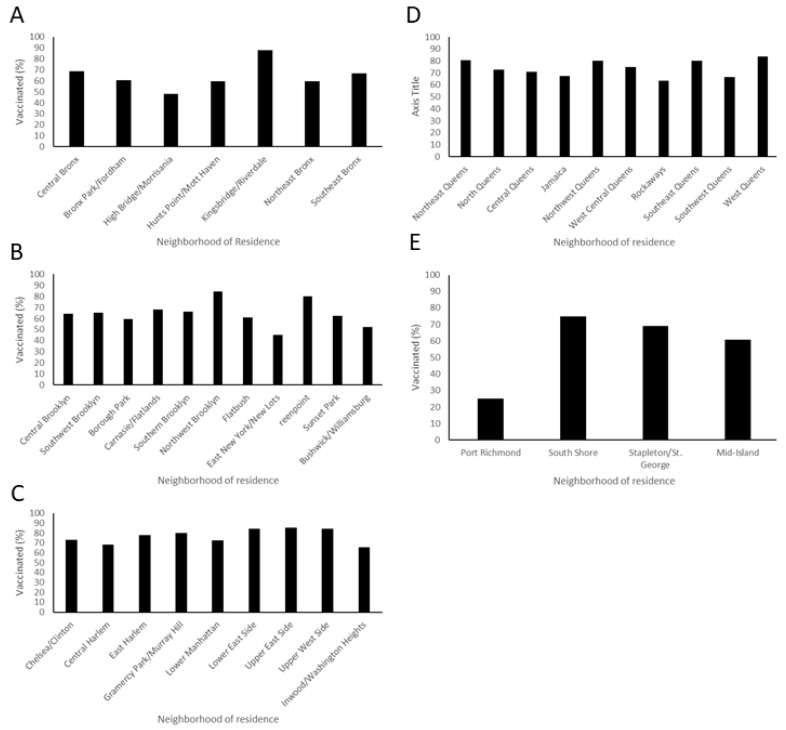
Figure 2.
Neighborhoods within boroughs show different vaccination rates between health professionals who live there. (A) Vaccination rates in the Bronx are significantly different based on neighborhood (p < 0.001, n = 479) and range from 87.75% to 48.33%. (B) Vaccination rates for health professionals in Brooklyn are dependent on neighborhood (p = 0.00028 n = 762). Vaccination rates in Brooklyn range from 45.24% to 84.62%. (C) Manhattan has overall high vaccination rates but they are significantly dependent on neighborhoods (p = 0.0169 n = 593). Health professionals vaccinated in Manhattan range from 65.57% to 85.59%. (D) Queens was more homogenous in HCW vaccination rate by neighborhood, with no overall significant difference found (n = 624). Rates in Queens range from 63.33% to 83.63%. (E) Staten Island vaccination rates significantly differed by neighborhood (p = 0.022, n = 89).

