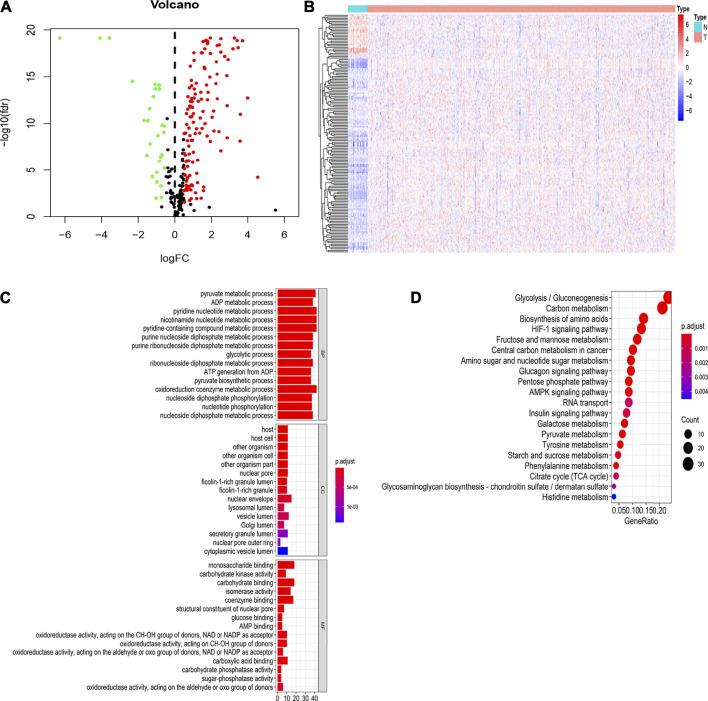
FIGURE 3.
Identification of differentially expressed genes (DEGs) related to glycolysis of TCGA datasets between normal and EC tissues and GO and KEGG pathway enrichment analysis of DEGs (A). Differential expression genes between two groups. The red dot is the up-regulated gene, the green dot is the down-regulated gene, and the black dot is the other genes without significant difference screened by the criteria of |Fold Change|>0.5 and FDR<0.05 (B). Hierarchical clustering of differentially expressed genes in two groups (C). The GO functional enrichment analysis of differential genes includes three domains: molecular function, biological process, and cell composition (D). KEGG pathway analysis of differentially expressed genes.

