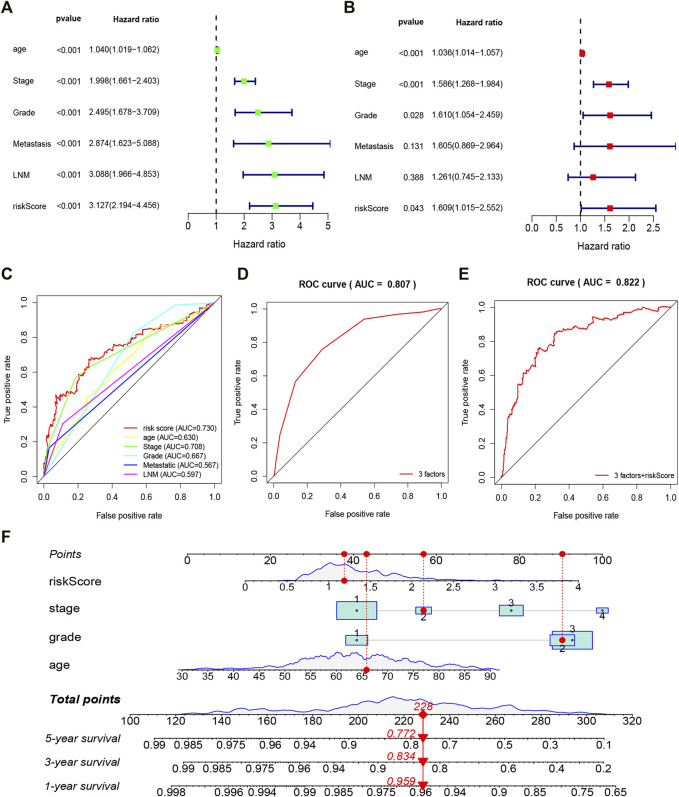
FIGURE 5.
Forrest plot of the univariate and multivariate Cox regression analysis in EC (A). The regression analysis of overall survival in EC (B). The multivariate Cox regression analysis in EC (C). ROC curve analysis was performed to evaluate the diagnostic efficacy of the gene signature and other clinical characteristics (D,E). ROC curve analysis was performed to evaluate the diagnostic efficacy of the three factors (age, grade, and stage) and three factors + riskScore (F). Nomogram is used to show the relationship between the variables in the prediction model and predict the 1–5 years overall survival rate of patients.

