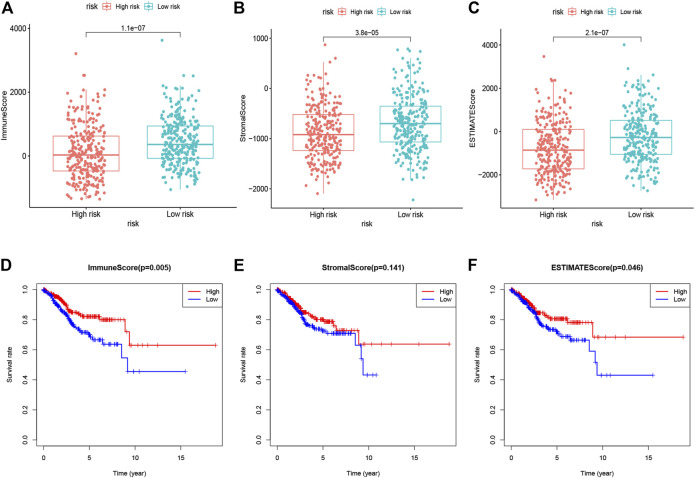
FIGURE 6.
Immune scores, stromal scores, and ESTIMATE scores of 10 glycolysis-related gene signatures were related to risk score (A). Immune scores for patients in the low- vs. high-risk group (B). The stromal scores for patients in the low- vs. high-risk group (C). The ESTIMATE scores for patients in the low- vs. high-risk group (D). Kaplan-Meier analysis of overall survival for patients with low vs. high immune scores (E). Kaplan-Meier analysis of overall survival for patients with low vs. high stromal scores (F). Kaplan-Meier analysis of overall survival for patients with low vs. high ESTIMATE scores.

