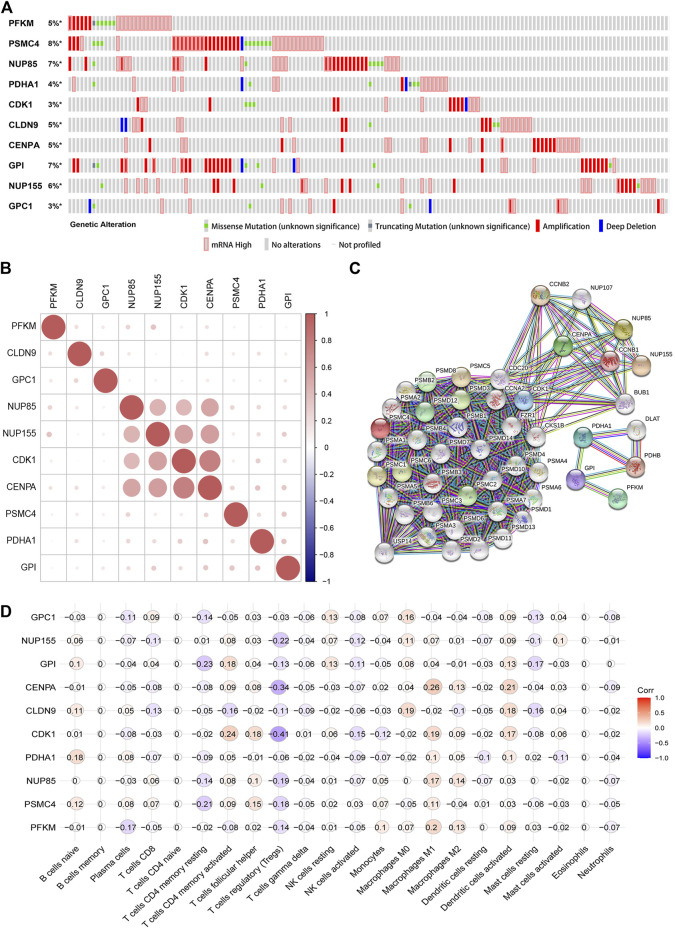
FIGURE 8.
Comprehensive analysis of glycolysis related genes in the gene signature (A). Gene alteration of selected genes in patients with EC from the cBioPortal website (B). Co-expression analyses of 10 glycolysis-related gene signatures in EC by the R “corrplot” package (C). Protein-protein interaction network of 10 gene signatures and other closely related proteins (D). Correlation between the 10 glycolysis-related gene signatures and various immune cells. Red represents a positive correlation, and blue represents a negative correlation.

