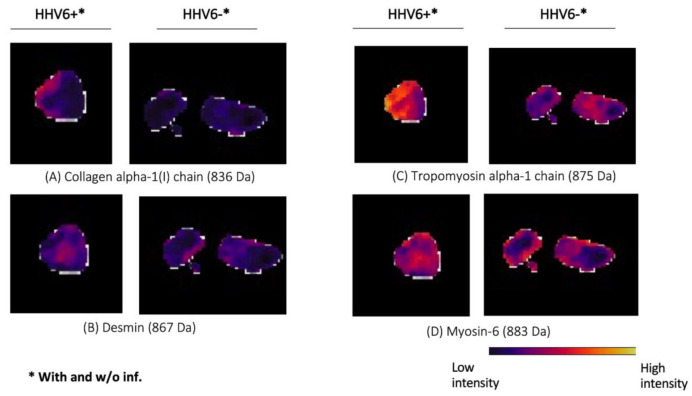
Figure 6.
Endomyocardial biopsies of HHV6-positive and -negative patients display differential intensity distribution in selected proteins. Relative peptide expression (color bar) is shown for MALDI m/z ion peaks of (A) collagen alpha-1(I) chain (836 Da), (B) desmin (867 Da), (C) tropomyosin alpha-1 chain (875 Da), (D) Myosin-6 (883 Da) chain (833 Da), which are higher in endomyocardial biopsy tissue from HHV6-positive patients compared to the virus-negative patients. (AUC > 0.6, <0.4 p < 0.001).

