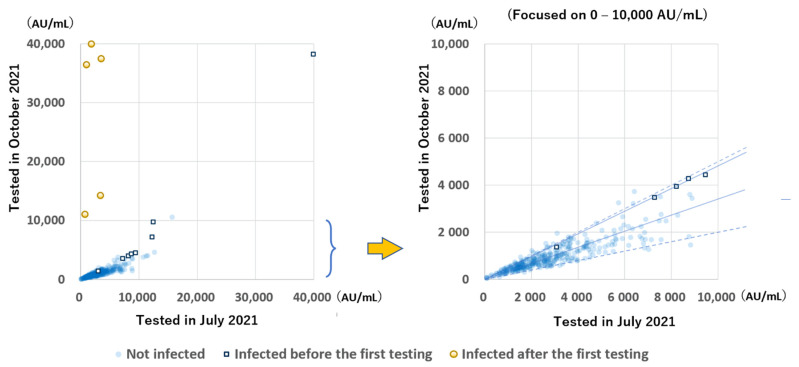
Figure 4.
Relation between the anti-S antibody levels tested, 94 to 109 days and 199 to 212 days after the second vaccination. The solid line indicates the median decrease in participants with and without infection (47.7% and 33.9%, respectively). Dotted lines indicate 50% and 20%. Most participants had antibody levels within the 20–50% range.

