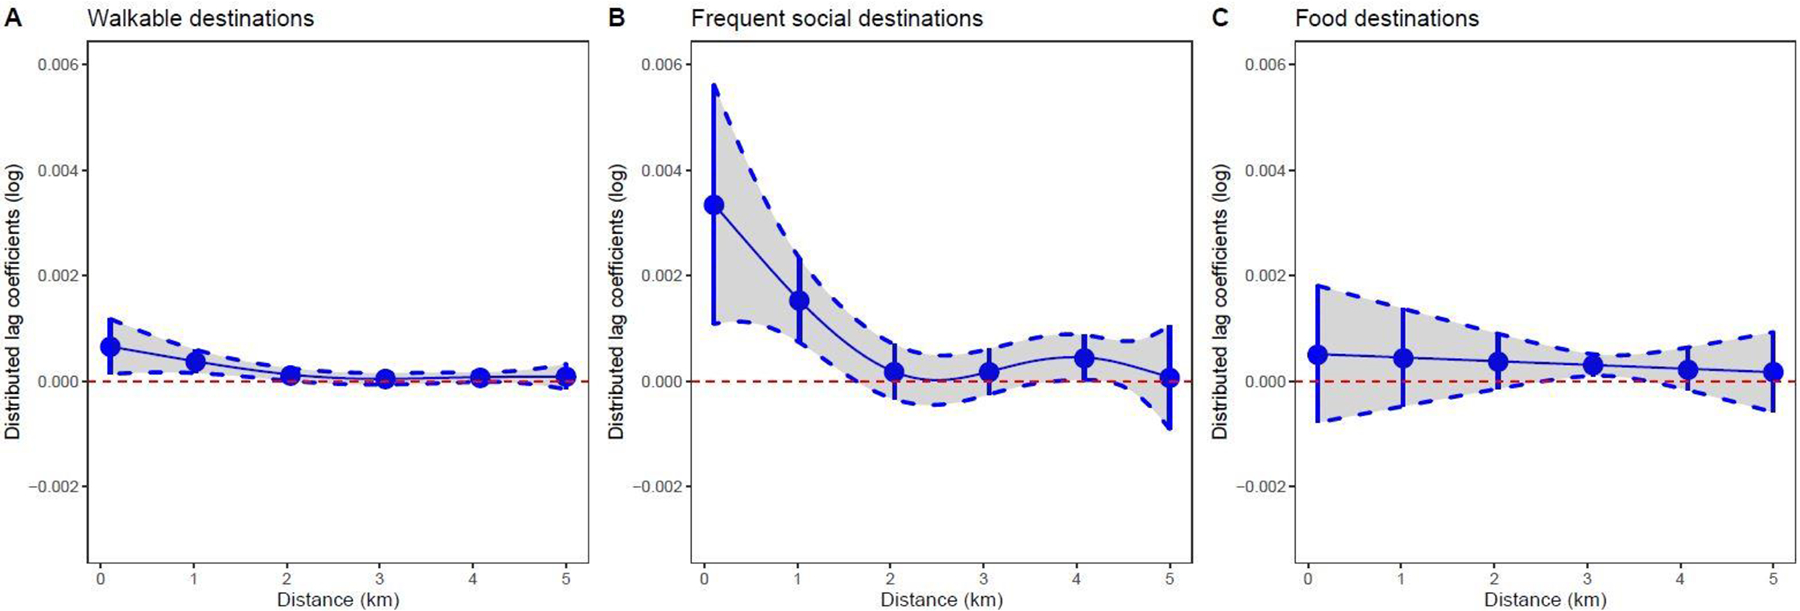
Figure 1.

Distributed lag modeling results for longitudinal data on transport walking (log scale) and built environment destinations in the ring-shaped network areas up to 5-km from residence. Panel A: all walkable destinations; Panel B: frequent social destinations; Panel C: food stores. Dashed lines represent 95% confidence intervals. Each model adjusted age, gender, race, education, per capita income and wealth index, BMI, self; rated health, arthritis last 2 weeks, car ownership, marital status, employment status, population density in 1-mile residential buffer, street network ratio in 1-mile residential buffer.
