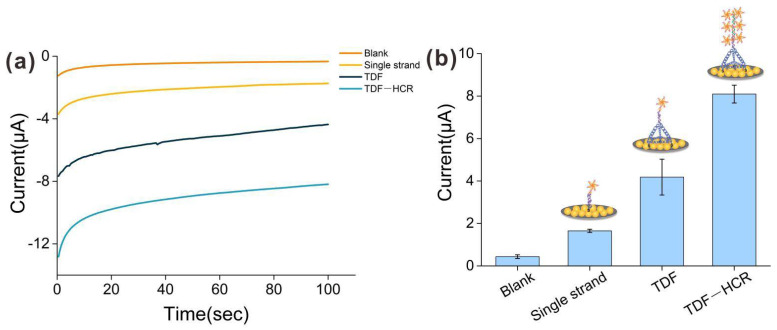
Figure 3.
(a) Typical I-T curves for three kinds of probes (single strand group, TDF group and TDF-HCR group) modified on SPGE at target concentration of 1 nM. The potential was held at 100 mV and the reduction current was recorded at 100 s. (b) The corresponding current of three kinds of probes when the scan time was 100 s. Error bars represent the SD of at least 3 independent experiments.

