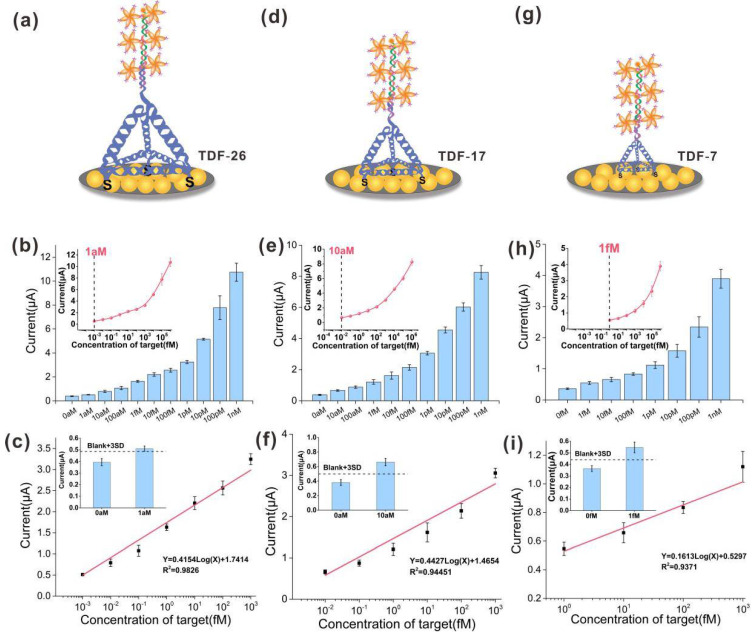
Figure 4.
Sensitivity of the E-cfDNA sensor mediated by differently sized TDF (TDF-26, TDF-17, TDF-7). (a,d,g) Scheme illustration. (b,e,h) Amperometric current amplification with corresponding increased concentration (from 0 nM to 1 nM) of target DNA. Insert: a dose–response curve between DNA concentration and current. (c,f,i) Linear calibration curves. Insert: Limits of detection. Error bars represent the SD of at least 3 independent experiments.

