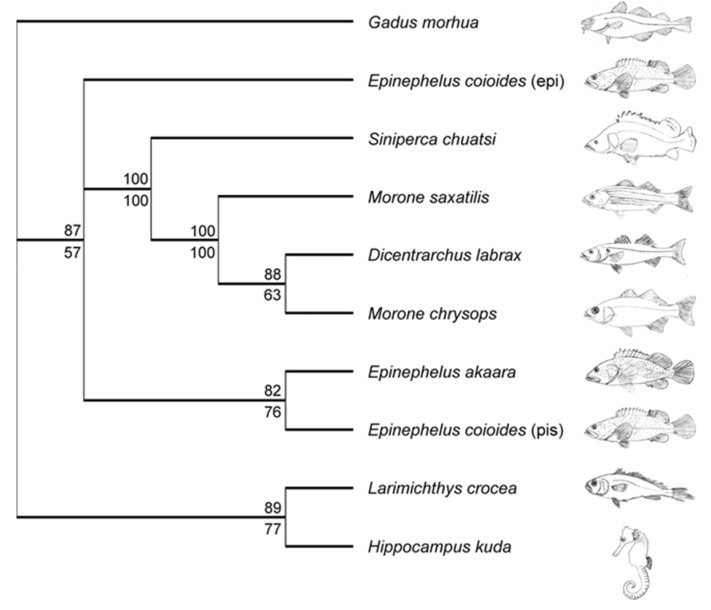
Figure 3.
Unrooted rectangular cladogram illustrating the phylogenetic relationship between piscidins. The SYM+G model was selected for the Bayesian analysis and the consensus tree was built after burning 1250 trees from the 5−10 generations. The likelihood phylogeny was obtained with a HKY nucleotide substitution model with a discrete gamma distribution (4 categories, gamma shape parameter 2.0) and 100 bootstrap data sets: Bayesian posterior probabilities and maximum likelihood bootstrap values are indicated as percentages above and below the tree nodes, respectively. Figure from Fernandes et al. 2010 https://doi.org/10.1371/journal.pone.0009501.

