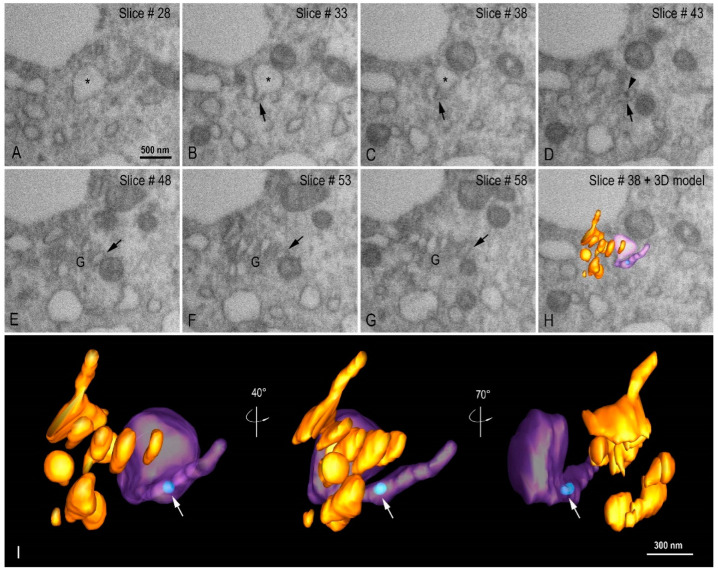
Figure 11.
Organization of the Golgi complex (G) and intermediate vesicle (IV). (A–H) FIB-SEM image sequence showing an IV (asterisk) with a tubular region (arrow) in close proximity with to the Golgi complex. A virus particle can be seen inside the tubular region of the IV (arrow head). (I) 3D model of the G (orange), IV (purple in transparence), and a virus particle (light blue, arrow) at different angle views. See video in Supplementary Material (Video S3).

