Figure 5.
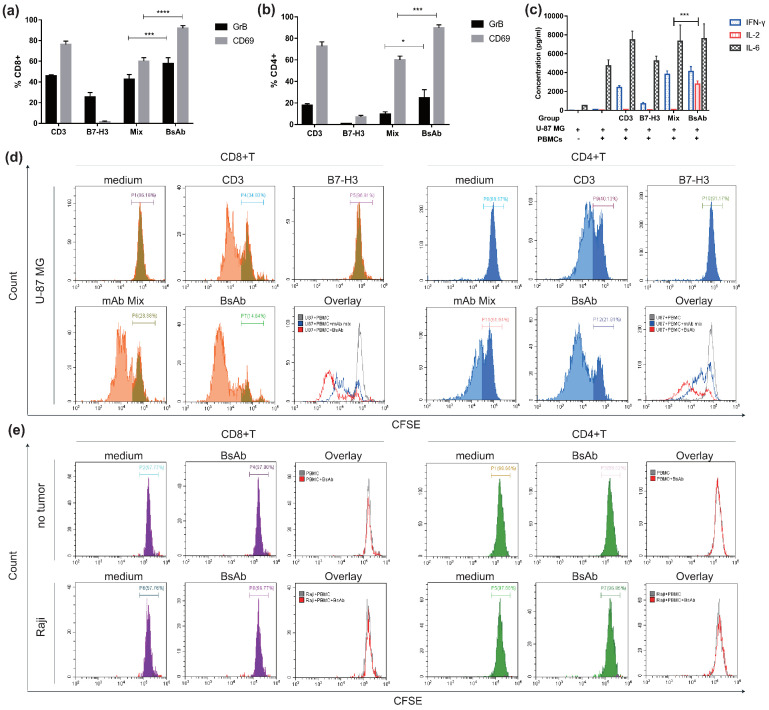
αB7-H3/CD3 induces T cell activation and proliferation in vitro. U-87 MG and PBMCs were co-cultured with indicated antibodies as described in methods. T cell activation markers (CD69 and GrB) and T cell proliferation were analyzed in CD8+ and CD4+ subsets by flow cytometry. The profile of cytokines released by PBMCs was quantified using ELISA. (a,b) Percentage of CD69 and GrB-positive cells in CD4+ or CD8+ T cell subsets. n = 3; (c) Secretion of cytokines by PBMCs induced by the indicated antibodies. n = 3; (d,e) T cell proliferation was measured using CFSE dilutions. Groups in which U-87 MG was replaced with no tumor or Raji (e). Representative histograms of CFSE-labeled T cells in CD8+ (left) and CD4+ (right) T cell subsets are shown. CD3, anti-CD3 mAb; B7-H3, anti-B7-H3 mAb; mAb mix, anti-CD3 and anti-B7-H3 mAb mixture; bsAb, αB7-H3/CD3. **** p < 0.0001; *** p < 0.001; * p < 0.05.

