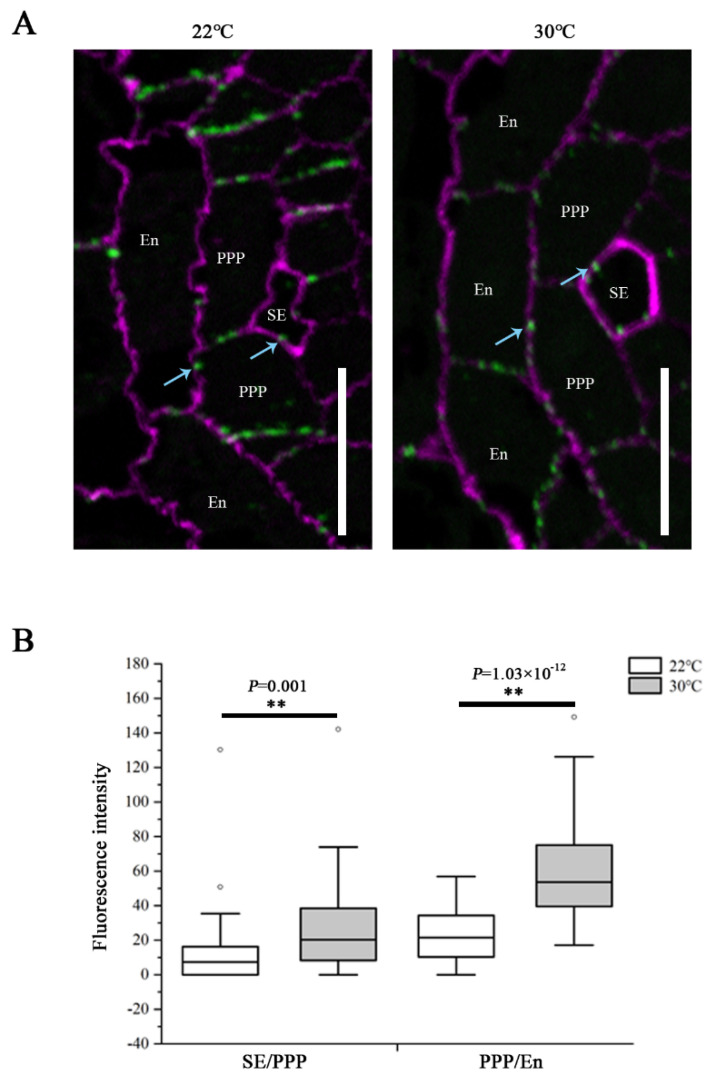
Figure 3.
Heat stress induces callose deposition at SE–PPP and PPP–endodermal interfaces within the unloading zone. (A) Immunolocalization of callose at plasmodesmata (blue arrows) at the SE–PPP and PPP–endodermis interfaces in the same region of the unloading domain (200 μm upward of QC) in the root tips of Col-0 at 24 h after transferred to 22 °C and 30 °C. Scale bars = 10 μm. (B) Mean fluorescence intensity of the callose signals are calculated in ImageJ. In the box plots, the boxes indicate the first and third quartiles, and the whiskers indicate the minimum and maximum values. The black lines within the boxes indicate the median values. Outliers are shown as dots. ** p < 0.01 (two-tailed, two-sample t-test).

