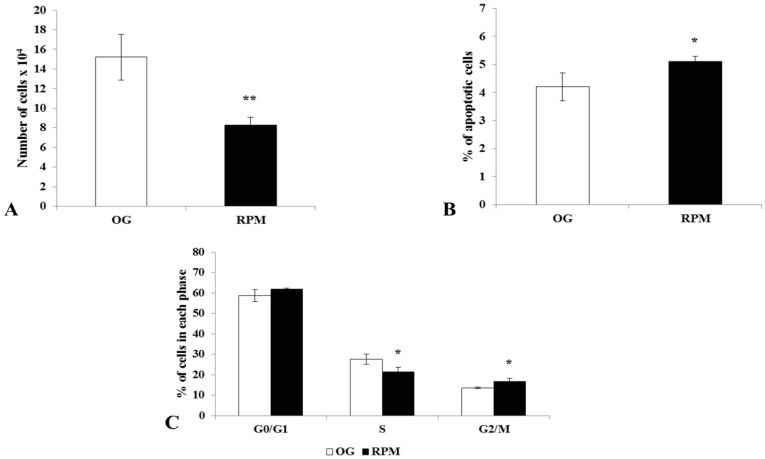
Figure 1.
Proliferation (A), apoptosis (B), and the cell cycle (C) in human dermal fibroblasts exposed to simulated microgravity (RPM) for 24 h. (A) Cell proliferation was determined by cell count assays performed by a particle count and size analyzer. (B) Apoptosis was determined by Annexin V-FITC and 7-AAD staining flow cytometry; histogram shows the percentage of apoptotic cells. (C) Cell cycle distribution was determined by propidium iodide staining flow cytometry. The histogram shows the percentage of cells in various phases of the cell cycle. Results are the mean ± SD of three independent experiments performed in triplicate. * p < 0.05, ** p < 0.01 RPM versus on-ground control (OG) by unpaired two-tailed t-tests.

