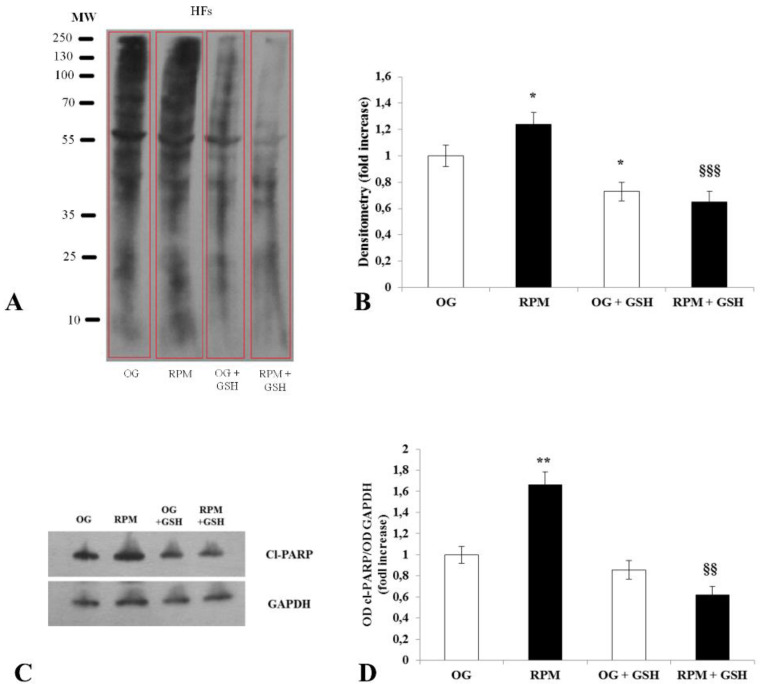
Figure 2.
Oxidative stress in human dermal fibroblasts after being exposed to simulated microgravity for 24 h. (A) Immunoblots for total carbonylated proteins from human fibroblasts exposed or unexposed to the RPM, treated or not with the antioxidant glutathione GSH. (B) Band densitometry analysis for total carbonylated proteins. Values are expressed as a fold increase of OG control, where each column represents the mean value ± SD of four independent experiments. SD is depicted as vertical bars. * p < 0.05 versus OG control; §§§ p < 0.001 versus RPM by ANOVA followed by Bonferroni post-test. (C) Representative Western blot analysis panel and (D) immunoblot bar charts showing the expression of Cl-PARP in human dermal fibroblasts exposed or unexposed to simulated microgravity, treated or untreated by GSH. Columns represent the densitometric quantification of optical density (OD) of a Cl-PARP signal normalized with the OD values of GAPHD as a loading control. Values are expressed as a fold increase of OG control. Each column represents the mean value ± SD of three independent experiments, where SD is depicted as vertical bars. ** p < 0.01 versus OG control; §§ p < 0.01 versus RPM by ANOVA followed by Bonferroni post-test.

